The Global Justice Platform aims to combine two key goals: socioeconomic equality and planetary habitability. We start by defining our basic objective in terms of shared prosperity. Namely, global income convergence to 60,000 Euros (PPP 2025) per year (5,000 Euros per month) for all countries by 2100 (Chap. 1.1) [1]All amounts in the report are expressed in 2025 PPP Euros, using the latest international macroeconomic data and price surveys in order to estimate purchasing power parities. We then examine the conditions under which this can be achieved while limiting global warming below 2°C. We distinguish between two sets of climate levers. The first, what we call "sufficiency", is defined as a major structural transformation of the economy, including a substantial reduction in working hours (Chap. 1.2), a large shift in consumption and production from material to immaterial sectors (especially education/health) (Chap. 1.3), and a significant change in food patterns, land use, and forest cover (Chap. 1.4). The second lever consists of climate investment and technological advances to decarbonize energy systems (Chap. 1.5). We finally discuss alternative scenarios in Chap. 1.6, and the evolution of global emissions and temperature across these scenarios. We find that both sufficiency and fast energy transition are necessary in order to limit warming below 2°C: changing energy systems alone is not enough (Chap. 1.7) [2]This Chapter aims to synthetize some of the material that is presented in a more detailed manner in Chancel et al (2026). We refer all interested readers to this work and to the online replication package.
1.1 Target 2100: Reconciling Equality, Prosperity & Material Sufficiency
The basic objective of the Global Justice Platform regarding equality and prosperity is described in Figure 1.1: full income convergence across all countries by 2100 to a level equivalent to that of today’s richest countries. While per capita monthly gross national income ranges from 290 Euros in Sub-Saharan Africa to 4,590 Euros in North America and Oceania in 2025, it reaches 5,000 Euros per month everywhere by the end of the 21st century, according to our benchmark scenario.

Achieving this target implies annual GDP per capita growth rates of around 0-0.5% in today’s richest regions (North America and Oceania, Europe) and around 3-4% in today’s poorest regions (Sub-Saharan Africa, South and South-East Asia), the latter comparable to the average growth rate of East Asia across the last 75 years (Figure 1.2) [3]In order to simplify the presentation, we concentrate on regional and world averages in the context of this report. All detailed country series are available online on GlobalJusticeProject.wid.world.

The justification for proposing a global convergence target is twofold. First, several non-Western countries are already well engaged in – or in some cases have already completed – a trajectory of convergence in per capita GDP with the richest Western countries. All Global South countries aspire to economic prosperity, and any analytically credible and politically viable framework for global climate cooperation must account for this aspiration. Second, the target of 60k Euros per year follows directly from our projections of the environmental impacts of global income convergence. As discussed in greater detail below, converging to this level is consistent with staying within a 2°C carbon budget, but it will require both significant structural transformation and massive investment in low-carbon energy infrastructure. Global convergence to a higher level of GDP per capita may not be feasible within reasonable climate targets. Convergence to a lower target (e.g., 15k or 30k Euros rather than 60k) could lead to further reductions in GHG emissions, but, as we shall see, what matters most is the structural transformation of the economy: targeted sufficiency can be more effective than large, uniform degrowth.
It is worth noting that near-zero growth in today's richest countries does not imply that the well-being of their populations is set to stagnate over the 21st century. First, accounting for the value of additional leisure time and the avoided costs of climate damages relative to high-growth, high-warming scenarios, even today's richest countries will enjoy a substantial rise in comprehensive well-being indicators between 2026 and 2100. Second, as described in greater detail in Chapter 2, the Global Justice Platform models strong inequality compression not only between but also within countries, meaning that even in today's richest countries, a large share of the population will see their monetary incomes rise over the next decades.
1.2 The Structural Transformation of Work: Toward Gender Equality
The first element of sufficiency in the Global Justice Platform is a significant reduction in global economic working hours per employed individual, from about 2,100 to 1,000 hours between 2025 and 2100 (Figure 1.3). Following Andreescu, Loubes et al (2025), all countries are also projected to converge toward full gender equality in economic labour hours – including similar employment rates for men and women – and domestic labour hours (Figure 1.4).


In line with historical experience, the reduction of working hours is made possible by productivity growth. In our benchmark scenario, we assume that hourly GDP converges to 125 Euros across all countries by 2100. This corresponds to relatively low productivity growth rates in Europe and North America/Oceania (0.8-0.9% per year between 2025 and 2100) and to substantial productivity growth rates in the world’s poorest regions (as much as 4.5% per year in Sub-Saharan Africa). Note that these catch-up growth rates are not larger than those observed in East Asia over the 1990-2025 period (4.7% per year). More generally, we observe annual productivity growth rates of around 4%-5% (or more) in all world regions that have experienced accelerated productivity convergence in the past, whether we consider East Asia in 1990-2025 or Europe in 1950-1990 [4]See Chancel et al, 2026, Figure 4 & Table 10. Global hourly GDP is about 20 Euros in 2025. It ranges from 4 Euros in Sub-Saharan Africa to 66 Euros in Europe and 68 Euros in North America/Oceania.
There are two broad reasons why individual countries and the world as a whole might choose to reduce working hours in the coming decades. First, countries have historically used a significant share of their long-run productivity gains to enjoy more leisure rather than to increase consumption. Second, the mounting threats to planetary habitability provide an additional rationale for reducing labour hours and limiting the economy’s material footprint. According to our benchmark projections, 44% of global productivity gains will be used to reduce labour hours over the 2025-2100 period, which is only slightly more ambitious than what happened in the past: 32% on average over the 1800-2025 period, and as high as 40% over the 1860-1980 period, which corresponds to the peak period of working-class mobilization for labour time reduction [5]See Chancel et al, 2026, Table 11.
Needless to say, the fact that the projections for labour hours and productivity are consistent with past experiences does not imply that they are easy to implement. They require specific sets of policies and institutions (including ambitious labour-hours legislation and massive investment in education, health and infrastructure), and most importantly, specific sociopolitical coalitions supporting these policies. The reduction in labour hours was driven by very strong collective mobilisation and legislative action over the 1800-2025 period, and the same will likely be needed in the future.
Lastly, gender equality – in terms of employment rates, as well as economic and domestic working hours – is an objective that is very important among younger generations in many parts of the world, much like working time reduction and the preservation of planetary habitability, yet it remains difficult to achieve. Achieving it will also require enormous political mobilizations and far-reaching changes in institutions, public policies, and social norms. Several existing policy tools in favour of gender equality should be systematized and reinforced, including equal parental leave, anti-discrimination rules, and gender quotas for job promotion. More radical tools are likely to be needed to rebalance power relations within households, including fiscal equalisation of income between women and men [6]The fiscal equalization of incomes within couples (or at least a very sharp compression of the gap, via differentiated rates of taxes/transfers levied at source on pay slips) could be imposed as default rule, unless both partners agree otherwise. See Aura (2005) for a comparable reform of survivor benefits in the context of the US Retirement Equity Act of 1984, with large redistributive impact. Generally speaking, the policies aiming at compressing income and wealth scales, which we will present in Chapter 2, are also complementary to gender equality objectives, given that men are vastly over-represented at the top of the income and wealth distribution.
We should also make it clear at the outset that the worktime reduction target is entirely determined by the objectives of emancipation and sustainability. If labour relations and production techniques can be reorganised so that longer working hours are no longer associated with subordinate, painful tasks and a larger material footprint, but rather with fully egalitarian, emancipatory, and immaterial tasks, then worktime reduction may no longer be as desirable [7]The way we model the evolution of sectoral inputs and material footprint is arguably too conservative, in the sense that we project future input-output matrices on the basis of past trends. See Chancel et al, 2026, Figures 25-27. In effect, we are barring the possible development of production techniques where lower material input intensity would be compensated by higher labour intensity. On the other hand, it is difficult to make consistent and realistic assumptions about input-output matrices departing radically from observed trends at the country and world levels. This is a key issue for future research.
1.3 Dematerializing the Economy: Education, Health, Culture and Other Services
As the second element of sufficiency, the Global Justice Platform projects that the share of material sectors in gross national expenditure (final consumption and investment) will be reduced by about one third – from 53% to 35% of total expenditure – at the world level between 2025 and 2100 (Figure 1.5), as well as a 40% rise in the share of Education/Health within immaterial sectors.

In the context of the world multisectoral input-output database, which we have constructed for the Global Justice Project, material sectors comprise Food, Housing and Construction, Manufacturing, Energy, and Transport; immaterial sectors comprise Education and Health, Leisure and Culture, and Other Services (Figure 1.6). Immaterial sectors generate almost no direct GHG emissions in their own production processes, and even accounting for the energy and material inputs they rely on, their emissions intensity remains approximately three to four times lower than that of material sectors [8]See Chancel et al, 2026, Figures 3a-3d. This is why a structural transformation toward immaterial sectors should play an important role in mitigating climate change.

The consumption shift envisioned for the coming decades constitutes a sharp departure from historical trends. Between 1970 and 2025, the share of material sectors in global gross national expenditure remained stable at 53%, and we observe a similar trend in most regions of the world. This stability can be explained by the so-called “Baumol effects”. Because they experience faster technical progress, the relative price of the goods produced by material sectors tends to fall over time in comparison to immaterial sectors (Figure 1.7). These falling prices help maintain high and rising demand and offset satiation effects, so that, at the end of the day, the share of material sectors in final consumption expenditure (in volume terms) does not decline, and may even rise in some cases, even though material needs are more than satisfied [9]See Odersky (2025) for a more detailed analysis of « Baumol effects » vs. « Engels effects ». If we were to use current relative prices, as is often done, then we would naturally find a decline in the share of material sectors in total expenditure between 1970 and 2025. But by using constant relative prices, a better way to measure the volumes of the various goods and services (and their consequences for GHG emissions and global warming), the striking finding is that there has been no dematerialisation of the global structure of expenditure over the past half-century.

This finding has major implications. In particular, it implies that there is no reason to expect market-driven economic development to lead to a major shift from material to immaterial sectors in the future.
In order to address this, the usual policy advocated by many economists would be a large corrective tax/subsidy scheme to raise the relative price of material goods and services relative to immaterial goods and services. In our view, however, there are several problems with this corrective tax solution. First, the tax would need to be very large. This means that, to counteract the enormous long-run decline in the relative price of manufacturing goods (say, compared to education/health), we might need a tax of the order of 200-300% or more. Next, a common problem with corrective carbon taxes – especially when they become so large – is their adverse distributional effect. In theory, it is always possible to neutralize these adverse effects by distributing part or all of the revenue to lower income groups. However, in practice, such promises often go unfulfilled, so that low- and middle-income households tend to have a very negative perception of these policies (largely for good reasons).
One way to address these concerns is to use non-linear corrective taxes that vary with the quantity of food, manufactured goods, or energy purchased over a given period, thereby implementing progressive price schedules, including low prices for the first units purchased by households and much higher prices for large consumers. For instance, the first units of electricity consumption are affordable, but the following ones are not; the first airplane flights over one’s lifetime are affordable, but the following ones are not; and so on [10]This is reminiscent of the famous progressive expenditure taxes advocated by Kaldor (1955) in a different context, i.e. in order to supplement the highly progressive income and inheritance tax system that was in place in Britain at the time. Like all progressive taxes, this requires more information than flat proportional taxes do, but this does not imply that it is infeasible.
Another limit of the standard corrective tax logic is that it tends to put excessive emphasis on price signals. In some cases, direct quantity controls (such as a fixed number of airplane flights) or regulations (such as a ban on thermal engines) can be more efficient than changing the price signal. In addition, profit-making logic does not always work well in some of the key sectors that are scheduled to expand in the Global Justice Platform, especially education and health. Rather than using a corrective tax/subsidy scheme on material sectors to change their relative prices (in effect subsidizing the private production of education, health and other services), a better solution might be to raise general tax revenue via progressive income and wealth taxation in order to expand the public education and health sector. In addition to extending the standard public sector, in which local and/or national governments directly organise the provision of free education and health services, one could also use some of the extra tax revenue to finance education and health vouchers, which could then be used to purchase services from the non-profit sector. This tax/voucher-sector logic could also be useful for other sectors, e.g., one might consider using “organic food” vouchers to allow households to purchase food from local producers, subject to certain conditions [11]See e.g. the projects of “food social security” (securite-sociale-alimentation.org). This could be used for many other goods and services (including energy, transport, culture, etc.).
As compared to the standard market-driven tax/subsidy logic, one additional advantage of the tax/public-sector and tax/voucher-sector approaches is that they allow for more direct margins of action to compress the income scale in the corresponding sectors and production units (whether they are public, private, non-profit, or mixed). More generally, they allow for the pursuit of a gradual “decommodification” of the economy, in the sense that more and more sectors are gradually organised outside the classic, lucrative capitalist logic [12]In his classic work, Polanyi (1944) argues that the process of “commodification” of the economy and the sacralization of markets and competition in the 19th century up until 1914 contributed to the weakening of European societies and to the disasters that followed. Conversely, the construction of the social state in the 20th century is inseparable from a process of decommodification of large sectors of the economy (education, healthcare, research, social security, and to a lesser degree transportation, energy, housing, etc.), particularly in Western and Nordic Europe, a process which could arguably continue in the 21st century and may be well-suited to address ecological challenges. See Piketty (2025). As we discuss in Chapter 2, different countries might well make different choices about how they organise the various sectors and the balance between public, private and non-profit governance and property structures, and we do not aim to prescribe a one-size-fits-all approach to these issues.
What is critical from our point of view is that all countries are able to sharply reduce the share of material sectors over the course of the 21st century. According to our benchmark scenario, the share of global working hours devoted to education and health rises from 11% in 2025 to 43% in 2100 (Figure 1.8).

While this increase may appear large, it is worth noting that countries such as Norway and Sweden already allocate around 30–35% of labour hours to these sectors today (Figure 1.9). Given the scale of future needs in health and education, driven by population ageing and expanding access to higher education among younger generations, even the projected rise to 43% may well turn out to be insufficient [13]See Chancel et al 2026 for a more detailed discussion of our sectoral productivity growth projections over the 2026-2100 period. In particular, we assume faster automation and productivity gains in leisure/culture and other services than in education/health. Note that the low productivity growth rates observed in housing/construction in 1970-2025 appear to partly reflect transitory effects (and rising housing prices) rather than permanent forces. See Chancel et al 2026, Appendix A.

1.4 Dematerializing the Economy: Reforestation, Land-Use and Food Habits
The third and last element of sufficiency in the Global Justice Platform is a substantial transformation of food patterns, land use, and forest cover. To understand why, it helps to consider today’s land-use patterns. Of all the land on Earth, less than 1% is covered by built-up areas (cities, roads, other infrastructure), while close to 33% is used for agriculture, almost as much as forests (28%) and wild grasslands and shrubs (10%) [14]The rest (29%) is covered by other barren land (mountains, deserts, etc.). See Chancel et al, 2026, Table 8 and Figures 2a-2c for historical evolutions. Of that agricultural land, two-thirds is devoted to grazing livestock. This makes dietary changes a direct lever to reduce emissions. First, cattle farming alone accounts for 11% of global emissions in 2025, making it far more environmentally costly than producing equivalent calories from plant-based sources. Second, the expansion of grazing land is the primary driver of deforestation, which itself accounts for around 6% of global emissions and destroys one of the planet’s most important carbon sinks [15]See Chancel et al, 2026, Table 9, for detailed breakdown and discussion.
Global forest cover declined by approximately 200 million hectares between 1990 and 2025, with no sign of significant deceleration. This trend is sometimes obscured in public debate by the fact that most regions of the Global North have experienced moderate reforestation in recent decades. However, continued deforestation in the Global South, particularly in Latin America and to a lesser extent in Sub-Saharan Africa and South and South-East Asia, has more than offset these gains, resulting in a net loss of around 200 million hectares of global forest cover over the period (Figure 1.10). This is aggravated by the fact that the areas currently undergoing deforestation include denser forests with much stronger CO2 absorption capacity per hectare (two to three times greater) than the areas undergoing reforestation.

In our benchmark scenario, we combine a complete ban on deforestation with a major reforestation program, so that global forest cover gradually recovers from approximately 4.1 billion hectares in 2025 to 4.8 billion by 2100, which corresponds roughly to the level last recorded in 1900 (Figure 1.11) [16]See Chancel et al, 2026, Figures 22a-24c for detailed projections by region.

According to our projections, this implies a 25% reduction in global grazing land (including a 40% reduction in Latin America) and the equivalent of a 25% reduction in total world meat production between 2026 and 2100 (adjusting for land-intensity by meat category). This also includes a substantial fall in today’s richest countries and largest meat consumers, especially for red meat (whose production is more land-intensive). By 2100, red meat consumption in North America is projected to fall by approximately a factor of 4.5, and by around 2.5 in Western Europe. While this may seem large, the point is that the amounts at stake in terms of GHG emissions and global warming are truly enormous, and that there appears to be no other way to proceed to put an end to ongoing deforestation and allow world forest cover to return to adequate levels.
Whether it takes the form of a reduction in total labour hours, a compression of the share of material sectors, or a change in food habits and land use, the move toward sufficiency that we advocate in the Global Justice Platform entails major benefits in terms of leisure time and planetary habitability. Still, it naturally also entails some costs for certain consumers and producers. Regarding our projected changes in land-use patterns and reforestation, the main losers are arguably producers in Latin America and Sub-Saharan Africa who have benefited from continuing deforestation in recent decades (Figure 1.10), as well as the owners and consumers of the corresponding companies in the North. The purpose of the Global Justice Fund and the system of country dividends is precisely to ensure that bottom- and middle-income classes in all countries benefit from this process, both in the South and in the North – a central issue which we will investigate in Chapter 2.
1.5 Dematerializing the Economy: Fast Move Toward Low-Carbon Energy
Together with sufficiency, the Global Justice Platform also requires a fundamental transformation of energy systems. As discussed before, different economic sectors vary in their emissions intensity, that is, in how much carbon and other greenhouse gases (methane, nitrous oxide, etc.) their production processes emit. Shifting toward less material-intensive sectors is therefore an important way to reduce emissions, but it is not enough: the production processes themselves must become cleaner. This means electrifying energy demand wherever feasible (such as transitioning vehicle fleets) and switching to low-carbon fuels (for example, in steel and cement production). Crucially, electricity generation itself must be decarbonised, moving away from fossil fuels toward renewables like hydropower, solar, and wind.
How far and how fast this transition can realistically go lies at the heart of one of the defining tensions in contemporary climate debates: the extent to which economic activity can be decoupled from emissions through technology alone. To address this question, we provide a detailed analysis of three different energy transition scenarios, which we summarise in Figure 1.12 and Figure 1.13. These three scenarios – Slow, Intermediate and Fast Decarbonization (SD, ID and FD), the last of which underlies the Global Justice Platform – are based on a detailed input-output decomposition of the energy sector into up to 14 subcategories covering different types of primary energy sources and electricity generation technologies. This approach allows emissions to be tracked through the specific fuel mix of each sector rather than through aggregate emission intensities, yielding a transparent set of assumptions that can be modified independently to construct alternative scenarios or conduct sensitivity analyses [17]See Chancel et al (2026) for a detailed discussion.


The three energy transition scenarios are broadly aligned with those developed by the International Energy Agency (IEA, 2025) but distinct from them in important respects. First, the IEA scenarios extend only to 2050 and are organized around three broad end-use sectors. In contrast, the Global Justice Platform runs till 2100 and is structured around eight main production sectors (see Figure 1.6). In addition, the Global Justice Platform does not assume large-scale carbon capture and removal to achieve net zero, relying instead on reforestation as a natural carbon sink [18]Due to high costs, numerous large-scale demonstration projects of carbon capture have been delayed or abandoned, and the volumes required are enormous relative to anything demonstrated so far. Long-term underground storage carries potential risks of leakage, and suitable sequestration sites are not universally available. Direct air capture faces even greater uncertainty as it remains extremely costly and has barely moved beyond pilot scale. Based on these uncertainties we consider large-scale deployment of both technologies as highly speculative (Jones and Lawson, 2022; Oreskes, 2024), and assume only limited carbon capture at industrial sites in our most optimistic projections. Unlike the IEA, it also assumes that the share of nuclear power in electricity generation falls by around one third by 2050, given well-documented concerns around safety and waste disposal, with the difference compensated for by a faster expansion of renewable sources, in line with the observed accelerated decline in renewables costs.
The SD scenario (Slow Decarbonization) broadly corresponds to the policies currently followed by the countries involved. In line with the latest trends and IEA estimates, this scenario involves a large and persistent use of fossil fuels, whose share in total final energy demand is projected to decline very slowly over time, from 69% in 2025 to 48% in 2100. The ID scenario (Intermediate Decarbonization) is a more proactive scenario that roughly corresponds to country official commitments and pledges, including policies that are not yet implemented, which the IEA refers to as the “STEPS” scenario (stated policies, as opposed to current policies). According to our estimates, the share of fossil fuels declines faster than under the SD scenario but remains substantial in 2100 (39% of total energy demand). In contrast, the FD scenario (Fast Decarbonization) is the most ambitious and is designed to reduce emissions as close to net zero as possible. The share of fossil fuels in final energy demand falls from 69% today to under 20% by 2050, reaching zero before the end of the century. In the meantime, the share of electricity rises from 24% today to 78% by 2100, with the remainder provided by low-carbon fuels (Figure 1.12) [19]See Chancel et al, 2026, Figures 40a-40h for similar projections for each of the 8 production sectors and for the household sector (direct energy consumption of households, primarily for residential heating and personal vehicle use).
The electrification of total energy demand is a key dimension of the energy transition, but it is not enough on its own: higher electrification does not reduce emissions if the additional electricity comes from carbon-intensive sources. Equally important, therefore, is the mix of electricity generation. Under the SD scenario (current policies) and the ID scenario (country objectives), fuel power plants are projected to disappear over the course of the 21st century, but the process is very gradual, so gas and coal power plants still play a major role well beyond 2050. In contrast, under the Fast Decarbonization scenario adopted by the Global Justice Platform, low-carbon sources (wind, solar, hydro, and nuclear power) are projected to rise steeply from 41% of total electricity generation today to 79% by 2035 and to 100% by 2050 (Figure 1.13).
Note that the Fast Decarbonization scenario requires massive investment in new technologies and infrastructure, in the order of 3-4% of world GDP annually over the next three decades, according to our synthesis of existing estimates [20]We synthetise and update previous estimates, including those published by Working Group III of the IPCC AR6 (IPCC 2022) and Climate Policy Institute (Buchner et al., 2023; Climate Policy Institute, 2025), who compute total annual climate investment requirements to achieve a net zero scenario based on a review of estimates of the costs to de-carbonize various sectors of the economy. As we will discuss later, these financial needs should be met in priority by the global rich, who have benefited disproportionately from global economic growth in recent decades and bear a major historical responsibility for the accumulation of GHG emissions.
1.6 Alternative Futures: Productivist Convergence and Persistent Inequality
We compare the environmental impacts of the “Sustainable Convergence” (SC) trajectory promoted by the Global Justice Platform with two alternative scenarios: “Productivist Convergence” (PC) or “Persistent Inequality” (PI). These two alternative scenarios project global convergence at much higher GDP per capita levels (PC) or continued between-country inequality (PI) and abstain from the key sufficiency elements of a reduction in labour hours, shifts in consumption patterns, and changes in food habits. In our benchmark simulations, both are also associated with more modest decarbonization pathways that align with current policies (Slow Decarbonization) rather than ambitious targets (Fast Decarbonization).
The Productivist Convergence scenario assumes the same productivity trends as the Sustainable Convergence scenario, but without any reduction in labour hours. As a consequence, all countries converge to a higher per capita GDP level of 120,000 Euros rather than 60,000 Euros. In our view, the PC scenario corresponds to a trajectory with relatively high levels of international cooperation to facilitate cross-country economic convergence (including large investment flows to poor countries), but little political mobilisation to reduce labour hours, total economic output, and material footprint (Figure 1.14a).

In the Persistent Inequality scenario, we assume that there is no reduction in labour hours (as in the PC scenario) and little cooperation and mobilisation to facilitate cross-country convergence, so that global inequality in per capita GDP remains very high until 2100 (Figure 1.14b). Rich countries are richer than in the PC scenario, but poor countries are substantially poorer, especially in Sub-Saharan Africa, so that average per capita GDP is scheduled to be 101,000 Euros, a level that is substantially higher than in the SC scenario (60,000 Euros) but lower than in the PC scenario (120,000 Euros). In line with available studies, we also assume faster demographic transition and fertility decline in poor countries – and therefore a lower world population in 2100 – in global convergence scenarios (SC or PC) than in the PI scenario, so that aggregate world GDP under the PI scenario is even closer to that under the PC scenario [21]Namely, we follow UN medium demographic projections in the PI scenario (with world population rising from 8.2 billion in 2025 to 10.1 in 2070 and 10.2 in 2100) and UN ABR projections (accelerated birth rate decline) under the SC and PC scenarios (with world population equal to 9.8 billion in 2070 and 9.4 in 2100). See Chancel et al, 2026, Figures 7-8. This Persistent Inequality scenario is arguably closest to a pure “business-as-usual” scenario, in the sense that it does not require any major policy action or change in course. In particular, it requires no international coordination to foster cross-country convergence, no reduction in labour hours to limit consumption, and no compression of the relative size of material sectors.

As we shall see, these two alternative scenarios are likely to lead to catastrophic global warming and a severe decline in planetary habitability. Note that by 2100, the size of the world economy – i.e. the real quantity of goods and services produced in the world – is about twice as small in the Sustainable Convergence scenario as in the two alternative scenarios. The gap is even larger if we focus on material sectors (Food, Construction/Housing, Manufacturing, Energy, Transport), where total world expenditure is almost three times smaller in the SC trajectory than in the other two scenarios (Figure 1.15). In that sense, the Sustainable Convergence scenario represents a significant attempt to apply the principles of material degrowth, at least in relative terms (i.e., relative to alternative high-growth scenarios) [22]In absolute terms, the SC trajectory is naturally associated to large positive growth, since poor countries are scheduled to catch up with the per capita GDP levels of today’s rich countries. According to our projections, aggregate world GDP is scheduled to rise from 139T (trillion Euros PPP 2025) in 2025 to 565T in 2100 in the SC scenario (as compared to 1023T in PI scenario and 1130T in PC scenario). The real growth rate of world GDP, which was equal to 3.2% per year on average between 1970 and 2025, is projected to slow down to 1.9% between 2025 and 2100 in the SC scenario, vs. 2.7% and 2.8% per year in the other two scenarios. While this can seem like a small gap in terms of annual growth rate (with a differential around one percentage point per year), the cumulated effect over the 2025-2100 period is substantial. See Chancel et al, 2026, Figure 43a. Note also that projected growth rates for world per capita GDP over the 2025-2100 period according to our three scenarios fall in the same range as those considered in the SSPs (Shared Socioeconomic Pathways) used in IPCC Reports. The main difference is that SSPs do not consider the possibility of complete convergence: in 2100, the income gap between the poorest and richest regions is around 1 to 3 or more (including in SSP1 and 2). See Chancel et al, 2026, Table 15. Another difference is that SSPs assume a larger population decline by 2100 than all UN population projections. See ibid., Figure 7.

1.7 Projecting Temperatures: Sufficiency & Energy Transition Are Complementary
We can now present our projections for GHG emissions and temperatures under the different scenarios. Our key conclusion is that both sufficiency and a fast energy transition are necessary to limit warming to below 2°C: neither changing energy systems alone nor sufficiency alone will be enough. Conversely, if we continue on the current trends, with no sufficiency and with slow energy transition, then we are heading for catastrophic global warming (4-4.5°C or more).
Figure 1.16 compares the temperature outcomes of the Sustainable Convergence scenario associated with the Global Justice Platform against the two growth-focused macroeconomic scenarios described above. Strikingly, under both the Persistent Inequality and Productivist Convergence scenarios, cumulative emissions over the 2025-2100 period reach 7250-7500 GtCO2e, translating into an expected temperature rise of 4.8°C to 4.9°C above pre-industrial levels by the end of the century. Aggregate emissions under the two scenarios are similar because, despite PI involving sustained inequality across countries while PC achieves full convergence to 120,000 Euros per capita, because aggregate global GDP and especially the average growth rates in the first decades are very similar under the two scenarios.

When societies shift to sufficiency, that is, reduce work hours by half by 2100, reorient consumption to immaterial goods, and shift food patterns to allow reforestation, cumulative emissions fall to 3635 Gt CO2e, corresponding to a projected 3.3°C temperature rise by 2100. This represents a significant improvement over the no-sufficiency scenarios but remains well above the 2°C temperature threshold. In the Global Justice Platform, sufficiency in production and consumption patterns must be combined with rapid decarbonization of the energy system. Then, projected emissions fall to 1075 Gt CO2e over the 2025-2100 period, yielding an end-century temperature rise of 1.8°C. To summarize, reconciling global income convergence with planetary boundaries requires simultaneous transformations of socioeconomic structures and energy systems (Figure 1.16).
Figure 1.17 puts precise numbers on the drivers of emission reductions. Sufficiency makes up for 44% of the total: 26% from the reduction in global annual working hours, 8% from the shift in consumption patterns toward immaterial sectors, and a further 10% from changes in food habits. The energy transition accounts for 55%, with electrification as the single largest driver, split between a greater share of electricity in final energy demand (10%) and the decarbonization of electricity generation itself (14%). The remaining reductions stem from changes in the composition of primary fuels (16%), efficiency gains (6%), and improvements in industrial processes and waste management (10%). Once again, it is clear that the Global Justice Platform must push for both sufficiency and a rapid energy transition to enable global income convergence while staying within a 2°C carbon budget.

Figure 1.18 illustrates what happens when the two growth-focused scenarios – which incorporate no sufficiency measures – are paired with an ambitious energy transition. Assume we shift from Slow Decarbonization (which corresponds approximately to current policies) to Intermediate Decarbonization (which is closer to official country commitments but not yet implemented); this shift would already require enormous policy action. The resulting temperature rise would be reduced from about 4.8°C-4.9°C to 4.1°C-4.2°C, which would still be very large [23]These temperature projections are very high but comparable to the projections presented in IPCC reports under the worst SSP scenarios. Note also that we include in our projections the latest estimates regarding the persistent use of fossil fuels in the coming decades. Other assumptions – including limited carbon capture and population decline, and relatively high growth in poor countries – can also contribute to explain the remaining gaps with other available estimates. Let us now assume, for the sake of reasoning, that the PI and PC scenarios can be combined with Fast Decarbonization. Projected temperature rise by 2100 falls from 4.8°C-4.9°C to around 2.6°C. This is a substantial improvement, but it falls short of what is needed. In particular, GHG emissions do not reach net zero by the end of the century under these scenarios, meaning that global warming would continue well into the next century [24]According to our extended projections, emissions continue to grow thereafter, and temperature rise could reach around 2.9°C-3.0°C by 2200, because of remaining industrial emissions and emissions from livestock farming that are not fully offset by forests. See Chancel et al, 2026, Figure 48. From a purely technical perspective, these scenarios demonstrate that accelerated transformation of energy systems and industrial processes can reduce emissions substantially by the end of the century even without the sufficiency elements that characterize our SC scenario but cannot reach net zero emissions.

In any case, we remain sceptical of such “green growth” pathways for two main reasons. First, there are other planetary boundaries beyond climate change (biodiversity loss, nitrogen and phosphorus cycles, freshwater depletion, ocean acidification) that cannot be avoided through decarbonization alone, and several of which have already been transgressed (Richardson et al., 2023). A pathway that maintains material consumption growth at current rates while decarbonising production processes will only further transgress these boundaries by continuing to exert pressure on ecosystems, resource extraction, and pollution. Decarbonization is necessary, but not sufficient, for comprehensive planetary habitability.
Second, we question whether such pathways are culturally and politically feasible without the kind of societal transformation that sufficiency entails. Fast decarbonization requires rapid retirement of high-carbon assets, massive investment in renewable energy, substantial increases in energy costs during the transition, and industrial policies that restrict consumer choice. These are disruptions that are difficult to sustain without a compelling vision of why they are worthwhile. The sufficiency narrative of the Global Justice Platform aims to provide precisely such a vision. Rather than framing decarbonization as a sacrifice in the service of continued material accumulation, it reframes the transition as an opportunity to build a more equitable and sustainable way of life. Working fewer hours and in a gender-equal way, reorienting consumption toward services (especially education/health), eating in a more sustainable (and healthy) manner, sharing prosperity globally, and living within a stable climate can plausibly increase human well-being compared to the trajectory of endless work and material growth. As societies shift in this direction, industries tied to material output shrink relative to those providing services, shifting the balance of political power, and making ambitious climate policy easier to sustain. Fast decarbonization and structural transformation are, in this sense, mutually reinforcing forces.
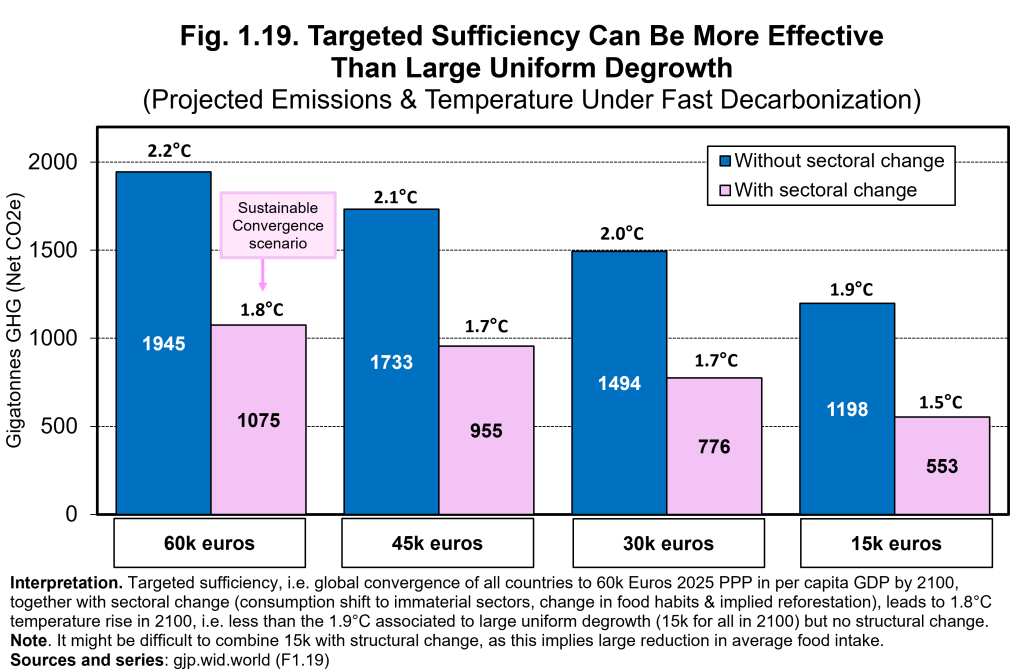
Figure 1.19 reinforces this point from a different angle. It shows projected emissions and temperatures under fast decarbonization, but global convergence to different GDP per capita levels, with and without sufficiency. The results are telling: targeted sufficiency can be more effective than aggregate degrowth. For instance, a 60k target with a large shift in consumption to immaterial sectors, changes in food habits, and implied deforestation leads to a 1.8°C temperature rise in 2100, i.e., less than the 1.9°C associated with a large uniform degrowth (15k for all in 2100) but without structural change. In other words, the sectoral composition of production and consumption patterns matters – and not only the level of GDP. We therefore argue that integrating the cultural transformation that sufficiency brings into public discourse may not only be more politically viable – in the sense that it offers society a positive vision of what replaces material sacrifice – but also be more effective environmentally.
From a methodological viewpoint, these results illustrate the fact that multidimensional material accounting – emphasizing sectoral shares, work hours, GHG emissions, land-use patterns, etc. – is, in many ways, more relevant than single-dimensional monetary accounting. Computing synthetic monetary indicators – including income and wealth scales between and within countries – can also be informative and even play a crucial role in collective discussion and democratic deliberation (for instance to evaluate the proper level of income and wealth inequality and progressive tax rates), but only under the condition that we always make explicit the material counterpart to these computations, and the fact that different social valuations for the various subcomponents would naturally lead to different monetary aggregates [25]For instance, all GDP targets used here (15k, 60k, 120k, etc.) are based upon the structure of relative sectoral prices prevailing in 2025. Using other relative prices (e.g. a higher relative value for education/ health than for material goods) would lead to other figures. Also, by adding plausible lower-bound valuations for leisure time and planetary habitability, we find that augmented per capita GDP in 2100 is higher in all countries in SC scenario than in PC & PI scenarios. See Chancel et al, 2026, Fig. 51a-51b.


