Summary: The Global Justice Report

The Global Justice Report: A Plan for Equality & Prosperity Within Planetary

The Global Justice Report attempts to set out a new vision for global progress in the 21st century: grounding human development and equality in planetary habitability. It explores the conditions under which the world could move toward this horizon and traces an economically and ecologically consistent transition path from 2026 to 2100.

Its main conclusion is simple: it is possible to reconcile planetary habitability and high well-being for all, but only if the transformation rests on three pillars simultaneously. Fast decarbonization of energy systems is necessary. But we also need a major shift toward sufficiency – understood as a sharp reduction in labour hours and material footprint and large changes in consumption patterns, food habits, land use, and forest cover. In addition, neither decarbonization nor sufficiency can be financed and politically sustained without a drastic reduction in inequality of income, wealth and power, both between countries and within them. The compression of global inequality is not only compatible with deep decarbonization; it is a necessary condition for shared prosperity on a finite planet.

The Global Justice Report is the first attempt to propose a fully quantified plan going in this direction, combining four dimensions that today’s debates often treat separately: redistribution at the world scale, a deep reform of the international financial and economic order, a radical transformation of energy systems, and substantial shifts in consumption patterns. to most climate scenarios, including by the Intergovernmental Panel on Climate Change (IPCC), the main novelty is we model all four dimensions together and place inequality and sufficiency at the center of the analysis.

Concretely: Per capita monthly national income converges to €5,000 in every country, closing a 16-fold gap. The share of the bottom half of global wealth increases from 2% to 30%, while the share of the billionaire class decreases from 6% to 0.05%. Nearly 90% of the world’s population double their income while working roughly half as many hours as they do today. Warming reaches 1.8°C by 2100, rather than over 4°C under baseline macroeconomic and policy trends.

The Global Justice Report is part of a broader international agenda for planetary habitability, social justice, and reform of the global financial architecture – including the Bridgetown Initiative launched by Barbados in 2022, combining international monetary reform, global wealth taxation, and climate finance; the recent Sevilla Commitment on development finance; the UN Tax Convention process; and G20 initiatives led by Brazil and South Africa on global inequality and the rebalancing of wealth and power within planetary limits. The main contribution of this report is to place these proposals within a quantified institutional framework, modelling socioeconomic convergence, temperature change, and distributional trajectories through 2100. Our broad conclusion is that it is possible to conceive of a quantitatively consistent plan for sustainable development on a global scale based on proposals such as the Bridgetown Initiative and other recent platforms.

Global Justice by 2100 at a Glance

Equality between countries: Average per capita monthly gross national income (PPP Euros 2025) rises to 5,000 Euros in all countries by 2100. Today, it ranges from 290 Euros in Sub-Saharan Africa to 4,590 Euros in North America/Oceania (a 16-fold gap).

Less work, more emancipation: Annual labour hours per employed person fall from about 2,100 hours today to about 1,000 hours by 2100, continuing the historical trend toward shorter working time.

Education and health for all: Per capita education spending rises to 8,400 Euros per year across all countries in 2100. Today, it ranges from 210 to 4,140 Euros. Health spending rises to 14,400 euros. Today it ranges from 110 Euros to 8,300 Euros. The share of global working hours devoted to education and health rises from 11% today to 43% in 2100.

Full gender equality: Women and men converge on equal amounts of economic and domestic labour and on equal average pay.

A world below 2 °C: Warming reaches 1.8°C under sustainable convergence and fast decarbonization, against over 4°C under persistent inequality and slow decarbonization (current policies).

Inequality compression: The income scale is compressed to 1 to 5, and the wealth scale to 1 to 10. This represents a major compression of global income inequality, on a scale similar to the reduction achieved in Western and Nordic Europe over the 20th century.

Wealth redistribution: The bottom 50% global wealth share rises from 2% to 30% (×15), while the top 0.001% share (billionaire class) falls from 6% to 0.05 % (÷100) – a striking redistribution.

Global Justice Fund: Annual expenditures (including country dividends and investment flows) reach 10.3 % of world GDP per year on average over the 2026-2060 period. In comparison, current official development aid and the combined budgets of the UN, IMF, and World Bank account for less than 0.4% of world GDP. This is justified by the fact that new climate investments alone will represent 3-4% of world GDP per year in the coming decades and will need to be supplemented by a big push in education and health expenditures to foster global convergence.

World Sovereign Fund: An active portfolio of sustainable assets reaching 10% of the world capital stock (or equivalently, to 60% of the world GDP). Initial asset accumulation comes from reinvesting a large part of global wealth and income tax revenues over the 2026-2035 period. 

Global wealth & income taxes: A global wealth tax (rising from 0% at 10 times the world average wealth to 20% per year on billionaires) and a global income tax (rising to 90% at the very top), both targeting around 1% of the world population.

Large majority benefit in every region: About 89% of the world will double their monetary income between 2026 and 2100; over 95% gain in the global South, and between 85–95% in the global North. Over 99% of the population is better off when the valuation of leisure and planetary habitability is included.

From global plutocracy to global democracy: All inhabitants of the world have equal political voice in the Global Justice Fund and the new international order. Currently, Europe & North America/Oceania have 4x as many votes at the IMF and World Bank as their population share, while Sub-Saharan Africa and South & South-East Asia have 4x fewer votes than their population share.

End of exorbitant privileges: The creation of an International Clearing Union and a new international currency to put an end to exorbitant privileges, i.e. the fact that rich countries benefit from higher returns on their foreign assets than what they pay on their foreign debt, thereby receiving a financial transfer from poor countries (0.6-0.8% of world GDP per year on average over 2000-2025 period, about twice as much as total development aid).

Ensuring Equality and Prosperity for all

The Global Justice Platform’s basic objective for equality and prosperity is full income convergence across countries by 2100. Today, per capita monthly gross national income ranges from 290 Euros in Sub-Saharan Africa to 4,590 Euros in North America/Oceania (a 16-fold gap), with a world average of 1,410 Euros. By 2100, all countries will converge to 5,000 Euros per month (Figure 1). This corresponds to a target of 60,000 Euros per capita annually. Achieving this target implies annual GDP per capita growth rates of around 0-0.5% in today’s richest regions (North America/Oceania, Europe) and around 3-4% in today’s poorest regions (Sub-Saharan Africa, South and South-East Asia), the latter comparable to the average growth rate of East Asia across the last 75 years.

There are two main reasons for this target. First, all countries in the Global South aspire to economic prosperity, and any credible framework for global climate cooperation must account for that aspiration. At the same time, convergence to a higher level would not fit within a 2°C carbon budget. The 5,000 Euros target and the resulting growth cap in rich countries meet at the intersection of these two constraints.

Near-zero growth in today’s richest countries does not mean that their living standards stagnate. From the perspective of monetary income alone, a large share of the population in rich countries would continue to see their incomes rise over the next decades, thanks to the sharp compression in wealth and income inequality within countries. Accounting for the value of additional leisure time and the avoided costs of climate damages relative to high-growth and high-warming scenarios, even today’s richest countries will enjoy a substantial rise in comprehensive well-being indicators.

Working Less, Achieving Gender Equality

The first element of sufficiency in the Global Justice Platform is a large reduction in working hours: from about 2,100 hours to 1,000 hours per year per employed person, between 2025 and 2100 (Figure 2). As observed in historical episodes of working-time reduction, productivity growth makes such reductions possible.

F2

Countries have historically used a significant share of their long-run productivity gains to enjoy more leisure rather than to consume more goods, and the mounting threats to planetary habitability now provide an additional rationale for limiting the economy’s material footprint. The required pace is only slightly more ambitious than what occurred over 1860-1980, the peak of working-class mobilization on this issue. Of course, the fact that the projections are consistent with past experiences does not imply that they are easy to implement. The reduction in working hours relied on very strong collective mobilization and legislative action in the past, and the same will likely be needed in the future.

In addition to reducing working hours, all countries converge toward full gender equality in the labour market, with similar employment rates for women and men, equal hours of economic and domestic labour, and equal average pay (Figure 3). Gender equality is widely endorsed as an objective among younger generations across the world, much like working-time reduction and the preservation of planetary habitability, but achieving it also requires enormous political mobilization and far-reaching changes in institutions, public policies, and social norms. Equal parental leave, anti-discrimination rules, and gender quotas for promotion need to be systematized and reinforced; more radical tools, including fiscal equalization of incomes between women and men, are likely to be needed to rebalance power relations within households. The compression of the income and wealth scales presented later is also complementary to gender-equality objectives, given the pronounced over-representation of men at the top of these distributions.

F3

The reduction in working hours also needs to be accompanied by a significant shift from material to immaterial sectors. The share of global working hours devoted to education and health rises from 11% in 2025 to 43% in 2100 (Figure 4). While this increase may appear large, it is worth noting that countries such as Norway and Sweden already allocate around 30–35% of labour hours to these sectors today. Given the scale of future needs in health and education, driven by population ageing and expanding access to higher education among younger generations, even the projected rise to 43% may well turn out to be insufficient.

Staying Below 2 °C

The only way to keep warming below 2°C while achieving our objectives of equality and shared prosperity is to combine sufficiency and a fast energy transition (Figure 5). Sufficiency includes a sharp reduction in labour hours and material footprint, a large shift in consumption from material to immaterial sectors (education/health), and a substantial change in food habits, allowing for a strict deforestation ban and a gradual return of global forest cover to the 1900 level. The transformation of energy systems entails the electrification of energy demand, a shift to low-carbon fuels in sectors such as steel and cement, and the decarbonization of electricity generation. Only a rapid and urgent decarbonization can bring the share of fossil fuels to under 20% of global energy demand by 2050 and to zero before the end of the century, with electricity accounting for nearly 80% of total energy demand and generated entirely from low-carbon sources by mid-century. This requires massive investment in new infrastructure, around 3-4% of world GDP annually over the next three decades, primarily financed by the global rich, who benefited disproportionately from global economic growth in recent decades and bear a major responsibility for historical emissions.

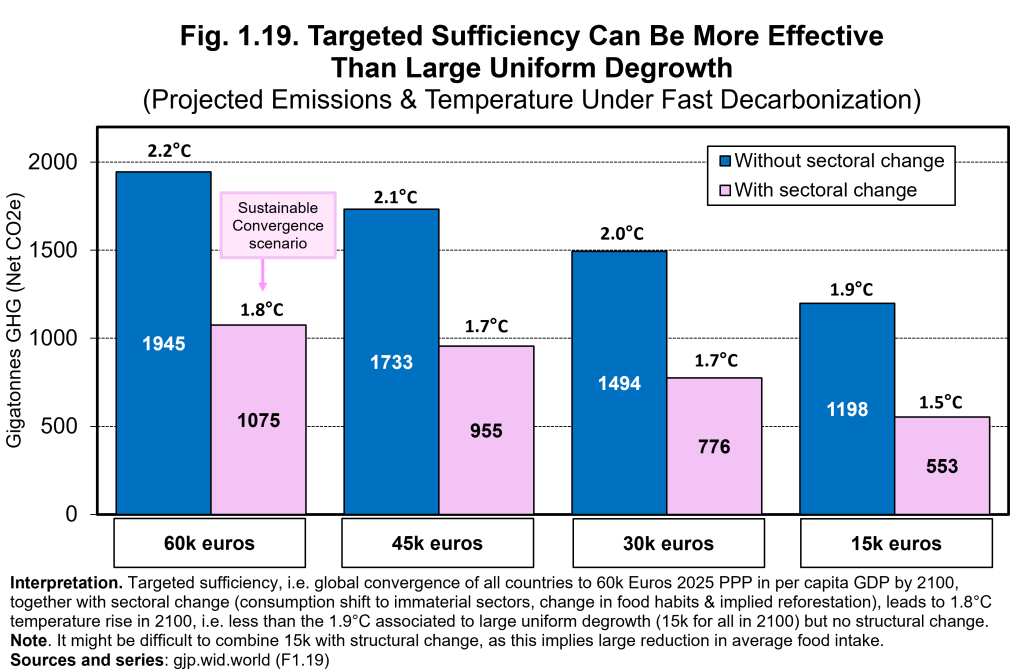
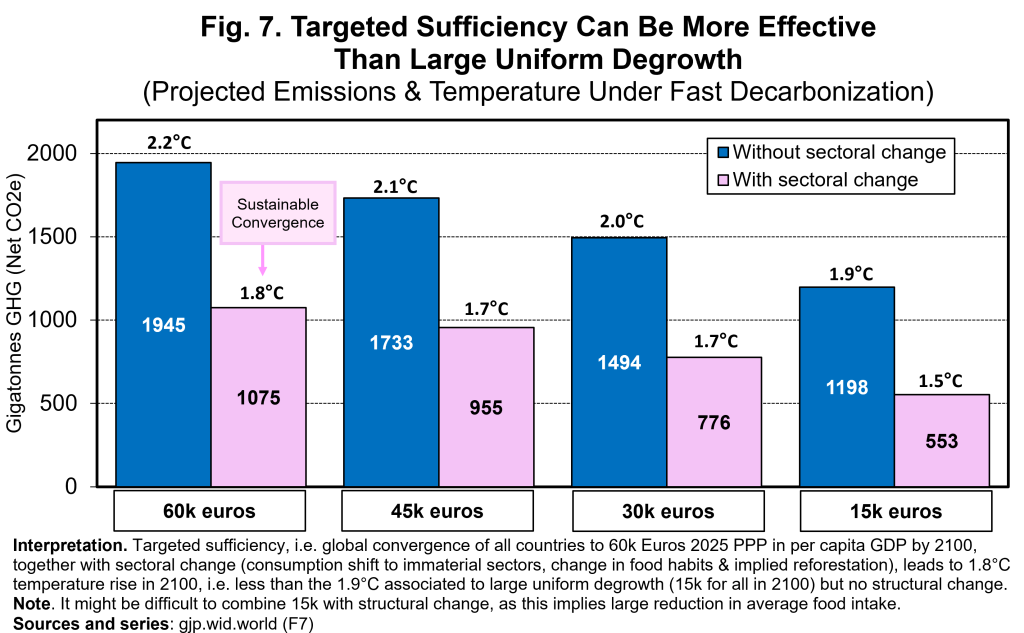
Only through the combination of sufficiency and an energy transition can humanity stay below 2°C (Figure 6). Otherwise, the world is heading for a climate catastrophe, with global warming above 4°C by 2100. In particular, under current policies, fossil fuels still meet roughly half of global energy demand in 2100. Under current pledges, they still meet around 40%. We also find that targeted sufficiency can be more effective than aggregate degrowth. For instance, a 60,000 Euros per capita GDP target with a large consumption shift to immaterial sectors, change in food habits, and implied reforestation leads to a temperature rise of 1.8°C in 2100, i.e. less than the 1.9°C associated with large uniform degrowth (15,000 Euros for all in 2100) but without sufficiency and structural transformation (Figure 7).

F6
F7

Building the Global Justice Platform

The Global Justice Fund (GJF) is the centerpiece of the Global Justice Platform and the key institution responsible for addressing these challenges. It is designed as a new international institution dedicated to global socioeconomic convergence and financing sustainable development and the energy transition on a global scale. Its key objective is to ensure equitable development opportunities for all countries while limiting global warming to below 2°C.

The GJF is responsible for raising adequate revenues (via global wealth and income taxation), managing a World Sovereign Fund (made up of previously accumulated tax revenues) and distributing country dividends (allocated to each country on an equal per-capita basis and used to finance climate investment, education, and health expenditures) (Figure 8). The global wealth and income taxes come in addition to national tax systems and target only the very top of the world distribution, around 1% of the world’s population.

F8

In the early years of the platform, the global wealth tax does most of the work, drawing substantial payments from the world’s billionaires, centimillionaires, and decamillionaires and channeling them into the World Sovereign Fund. The Fund accumulates assets equivalent to about 60% of world GDP, or about 10% of the world capital stock, and stabilizes around that level (Figure 9). Once it is built up, the income from those assets gradually replaces tax revenue as the platform’s main source of financing: by 2050, investment income already represents three-quarters of GJF resources; by 2100, it represents all of them.

F9

On the expense side, country dividends are distributed on an equal per-capita basis and therefore represent a smaller share of GDP in rich countries than in poor ones, on average about 2-3% of GDP in Europe and North America/Oceania over 2026–2100, against 5% in South & South-East Asia and 9% in Sub-Saharan Africa. They come with strong conditionalities: climate targets (low-carbon energy investment, verifiable greenhouse-gas emissions, end of deforestation), human capital targets (education and health expenditure), and inequality targets (distribution of income and wealth). Beyond financing country dividends, the World Sovereign Fund also serves a second key purpose: a permanent public stake of about 10% of the world capital stock, contributing to the reorientation of world investment toward sustainable development.

Funding It at the Right Scale

Annual expenditures of the Global Justice Fund average 10.3% of world GDP per year over the 2026-2060 period. This vastly exceeds the total combined resources currently allocated to development aid and international organizations (less than 0.4% of world GDP) (Figure 10). This is because the scale of the challenge is unprecedented: climate investment alone amounts to 3-4% of world GDP per year in the coming decades, and the GJF also needs to help finance human capital expenditure to foster global sustainable convergence (Figure 11).

F10
F11

A central objective of the Global Justice Platform is equal access to high-quality education and health for all. Total education and health spending rises from 13% of world GDP today, with very large disparities across regions, to about 38% of world GDP everywhere by 2100. The Global Justice Fund finances the early push: between 2026 and 2050, it helps poor countries close the most extreme gaps in education and health spending. Per capita education expenditure today ranges from 210 Euros in Sub-Saharan Africa to 4,140 Euros in North America/Oceania, a gap of 1 to 20 (Figure 12), and health expenditure ranges from 110 Euros to 8,300 Euros, a gap of more than 1 to 70. By 2100, all countries will converge to 8,400 Euros per person for education and 14,400 Euros for health, but this will take decades to achieve equal access to education and health. By 2050, education and health gaps are still projected to be around 1 to 3 in our benchmark scenario.

F12

This reflects the fact that the Global Justice Platform is a relatively moderate, gradualist platform (arguably too moderate and gradualist). Bringing immediate equal access to today’s rich-country levels of education and health would require a Global Justice Fund roughly four times larger, around 40 % of world GDP, rather than 10%. Our benchmark proposals trade off ambition against political feasibility and are open to scaling up.

Compressing the Income and Wealth Scale

The Global Justice Platform aims at substantial compression of national income and wealth scales over 2026-2100. Global wealth and income taxes are designed both to raise the resources needed by the Global Justice Fund and to curb the concentration of income, wealth, and power at the top of the world distribution. Country-level policies (progressive taxation, minimum wages, pay-scale regulations, labour market rules, workers’ representation on corporate boards) are expected to play the leading role in reshaping each country’s income distribution in the long run. The income scale within each country is projected to converge to 1 to 5 by 2100; the corresponding steady-state wealth scale to about 1 to 10. The combined effect of between-country convergence and within-country compression brings the share of the global top 10% in post-tax income from 52% today down to 18% in 2100, while the bottom 50% share rises from 8% to 38% (Figure 13).

F13

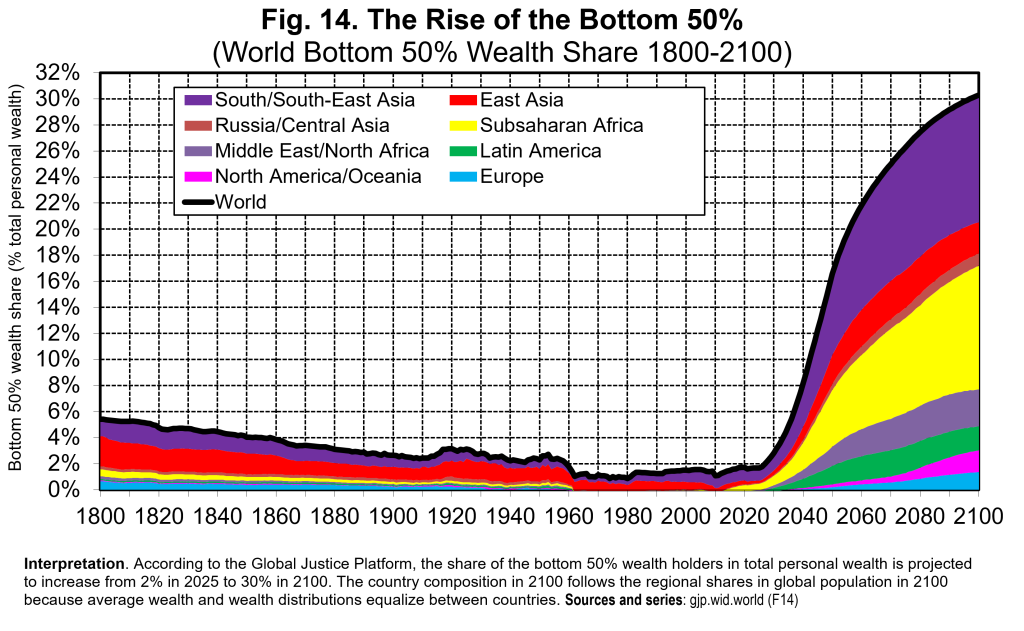
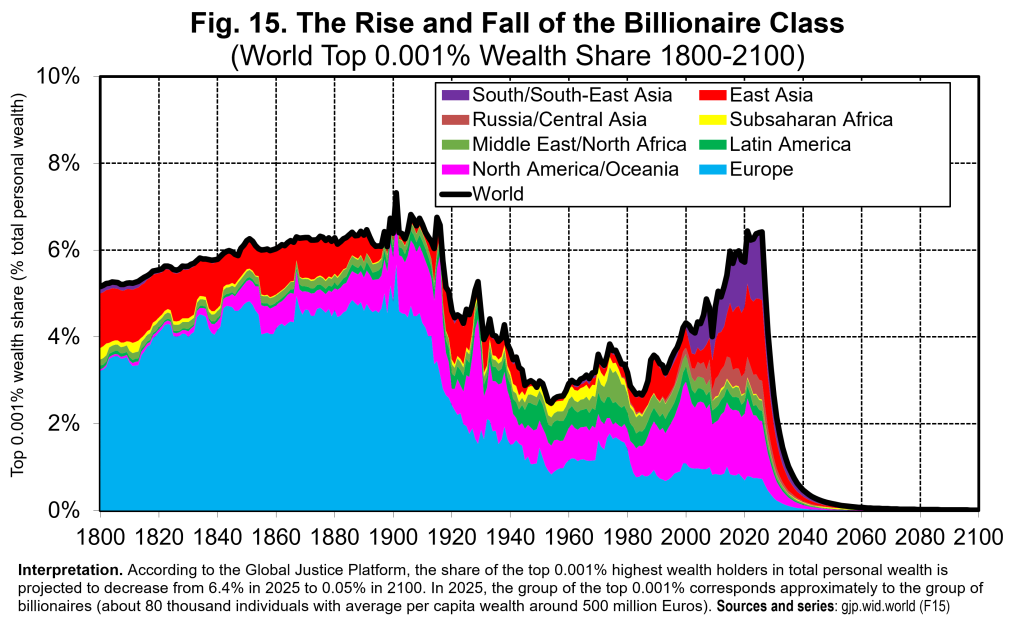
The wealth picture is even more stark. The share of the bottom 50% of the world’s wealth distribution rises from about 2% today to about 30% by 2100, a 15-fold increase (Figure 14). The wealth share of the world’s billionaire class falls from 6.4% to 0.05%, a decline of more than a hundredfold (Figure 15).

F14
F15

The projected compression of the income and wealth scales is consistent with the long-term trends observed in some of the richest countries in the world, particularly in Western and Nordic Europe. For instance, the ratio between the post-tax income threshold of the 99th percentile and that of the 10th percentile (P99/P10) declined from about 32 in 1900 to 3.9 in 1990 in Nordic Europe, and it is projected to decline from about 37 on average today at the world level to 3.3 by 2100. History suggests that this kind of compression does not come at the expense of prosperity. The countries that experienced the most substantial reduction of top-end inequality in the twentieth century (Nordic and Western Europe) are also those that experienced some of the most impressive productivity gains. The United States, where top inequality rose markedly after the 1980s-1990s, did not enjoy faster productivity growth than Western and Nordic Europe over the same period.

Building National and Global Coalitions

A vast majority of the population (about 95–98% in the Global South and 85–95% in the Global North) benefits from the Global Justice Platform in purely monetary terms (Figure 16). At the global level, 89% of the population sees their annual monetary income more than double between 2025 and 2100, while less than 2% experience an income decline. In the poorer regions, gains are nearly universal: about 99% of the population sees more than 100% growth in monetary income, with virtually no income decline.

F16

In the richer regions, the gains are smaller, but the majority still benefit. About 45 % of the population in North America/Oceania and 28 % in Europe at least double their monetary income; a minority (14 % in North America/Oceania and 6 % in Europe) sees their monetary income decline. Those losing out sit essentially at the very top of each country’s income distribution. The bottom and middle of the distribution come out ahead, both through rising monetary incomes and through better-funded education and health systems financed by country dividends.

These material benefits come on top of important non-monetary ones: more leisure, less warming, a financed energy transition, and curbing the destabilizing effects of extreme inequality. Once the value of leisure and planetary habitability is taken into account (with all due caution), more than 99% of the world’s population is better off in 2100 than today, including in the richest regions.

Nevertheless, the platform is likely to face fierce political opposition, and not only from the ultra-rich. In rich countries, between 10% and 20% of the population would be on the margin of losing out, especially when comparing their situation to alternative high-growth, high-warming trajectories. They could be persuaded that sufficiency, free time and planetary habitability are not worth the trade-off. The cultural and intellectual battle is therefore not only about the taxation of billionaires and multimillionaires; it is also about the value we place on sufficiency, free time and planetary habitability themselves, and the end of “classless ecology”.

Building a Democratic World Order

The Global Justice Platform requires not only the creation of the Global Justice Fund (GJF) but a broader transformation and democratization of the international economic and monetary system. The GJF itself should be conceived as a new international institution, governed by strict rules of democracy and transparency, with regular budgetary decisions taken under a double-majority rule: 55% of countries representing 60% of the world’s population.

This stands in sharp contrast to today’s plutocratic system. At the IMF and World Bank, GDP-based voting gives Europe & North America/Oceania roughly four times their share of the world population. At the same time, South & South-East Asia and Sub-Saharan Africa hold only about a quarter of theirs. The Global Justice Platform proposes a transition to one-person-one-vote, immediately or at the latest by 2050 (Figure 17). Beyond the GJF, this implies broader reforms of the international monetary and trade system, including the creation of an International Clearing Union and the transformation of the IMF into a United Nations Central Bank that issues a new international reserve currency to end exorbitant financial privileges.

F17

To a large extent, the current global plutocratic system resembles the wealth- and income-based voting systems that were applied in many countries in Europe and elsewhere in the 19th century and up until the early 20th century (including countries like Sweden, where inequality was at the time deeply embedded in the political system). The shift from global plutocracy to global democracy, which we envision for the 21st century in the context of the Global Justice Platform, has the same status as the shift from national plutocracy to national democracy that occurred in the 20th century. It is both a goal and a means.

The Global Justice Platform is based on forward-looking universalist principles, with equal per-capita country dividends for all countries and identical tax schedules everywhere: all billionaires pay the same, whether they come from the North or the South. Because country dividends account for a larger share of GDP in the South, and the global rich predominantly come from the North, the Global Justice Platform (GJP) also implies a form of class-based reparatory justice. In practice, however, the North-South transfers implied by the GJP are relatively modest: about 0.8% of world GDP per year over the 2026–2100 period. This is significantly less than the magnitude of annual transfers that would be required to compensate for the cumulative colonial and climate damages imposed by Europe and North America/Oceania between 1800 and 2025 (about 3%) (Figure 18).

F18

This suggests that the GJP would need to be scaled up to fully account for historical responsibilities and to better approach universal, equal access to education and health. The scaling up could come from more progressive tax schedules and country dividends, or by direct reparations supplementing universal policies.

If necessary, the Global Justice Platform can be implemented with an incomplete coalition of countries, including the absence of the US and/or China. According to our projections, the climate damages imposed by the US on other countries would be about 3% of world GDP per year, on average, over the 2026-2100 period if the US does not participate in the GJP. Under simplifying assumptions, other countries should impose a corrective tax of approximately 80% on all US exports to collect tax revenues approximately equivalent to the damage. Given the projected decline of the US share in world GDP – from 30% in 1945 to 15% in 2025 and 5-10% by 2100 – it is likely that such tariffs would induce the US to join the GJP. The same conclusion applies to the case of China, but with a higher tariff (180% or more).

To conclude, the Global Justice Platform finds that a habitable, equal 21st century is materially possible. The carbon budget allows it, and history offers precedents at comparable scales, from the rise of universal suffrage to the universalization of health and education to the inequality compression of the 20th century. What stands in the way is not technical impossibility but political choice and the hard but crucial work of building a coalition behind it.

Conclusion: A Global Citizen Movement for Social Justice

We stress once again that the Global Justice Platform which we have presented in this report has many limitations and shortcomings.  The sole ambition of the GJP is to participate to a collective deliberative process on global justice. Our main conclusion is that it is possible to reconcile planetary habitability and high well-being for all, but that this requires a major shift toward sufficiency (including a sharp reduction in labour hours and a large change in consumption patterns, food habits and land use), fast decarbonization of energy systems requiring unprecedented climate investments, and most importantly a drastic reduction in inequality of income, wealth and power in order to ensure that these transformations are economically financed and politically sustained. We have proposed one quantitatively and institutionally grounded, if necessarily incomplete, step in that direction. We will be delighted if it can contribute to stimulate other contributions and discussions.

A Platform Complementing Many Other Platforms

The Global Justice Platform should be viewed as a small contribution to a broader collective movement that is already well advanced at the world scale, particularly in the Global South, and to a lesser extent in the North.
 
In particular, we stress that several of the basic features of the Global Justice Platform – e.g. the creation of a global wealth tax and the issuance of an international currency to help finance development and climate investment – are shared with other recent policy proposals. For instance, the GJP is very close in spirit to the “Bridgetown Initiative on the International Development and Climate Finance Architecture”, launched in 2022 by a coalition of governments from the Global South (under the auspices of the Prime Minister of Barbados). The Bridgetown Initiative stresses the complementary role of global wealth taxation and international monetary reform, as we do. The main novelty is that we attempt to embed these proposals into a full-fledged quantitative and institutional analysis, including the modelling of global socioeconomic convergence, temperature change, and distributional trajectories. Our broad conclusion is that it is possible to conceive of a quantitatively consistent plan for sustainable development on the world scale on the basis of the premises of the Bridgetown Initiative. Our work is also consistent with the recent Sevilla Commitment on development finance, the UN Tax Convention process, and G20 initiatives led by Brazil and South Africa on global inequality and the rebalancing of wealth and power within planetary limits.[PIN| |See also the plan on global poverty and sustainability coordinated by the UN Special Rapporteur on Extreme Poverty and Human Rights (De Schutter, 2026), the reports by the Tax Justice Network (Mager, 2025), the work of the International Panel on Social Progress (IPSP), and the climate & redistribution plans coordinated by the GRD network (Global Redistribution Advocates) (Fabre, 2024, 2026; Fabre et al, 2026), which share some of the GJP features (including global progressive taxation and country transfers). Our main novelty is to embed global taxes and transfers and institutional changes into the framework of global convergence between countries, climate projections and full-fledged distributional and multisectoral analysis.] We view these various contributions to the public discussion as highly complementary to one another, and we very much hope that they will contribute to feed the global debate on these crucial issues in the future.
 
The Global Justice Platform is also closely connected to the growing debate on colonial and climate reparations, and in particular to the discussion on how to define equity between countries in a context characterized by large disparities in historical responsibilities. While the United Nations Framework Convention on Climate Change does recognize the principle of “Common But Differentiated Responsibilities and Respective Capabilities” (UNFCCC, article 3.1), the question of how to formalize and translate this principle into quantitative policies remains largely unresolved and inherently conflictual. A number of actors from the Global South – including the Climate Equity Monitor (CEM) initiative – have stressed the need to take historical GHG emissions into account to operationalize the concept of climate equity.[PIN| |See climateequitymonitor.in and Kanitkar et al (2019, 2024), as well as the work by the Climate Action Network (CAN) and the Global Campaign to Demand Climate Justice (DCJ). See also the Global Solidarities Task Force (GSTF) initiative set up by Barbados, Kenya and France to explore options for international taxes financing climate reparations in the Global South.] We have followed this approach in order to assess the extent to which the Global Justice Platform meets this objective. Our conclusion is that the GJP should be scaled up and/or supplemented by other transfers and policies so as to be able to fully compensate for historical damages. Our approach to climate and colonial damages is also consistent with the recent work by the American Society for International Law (ASIL), the Center for Reparations Research (CRR, University of West Indies), the Reparations Commission of the Caribbean Community (CARICOM) and the African Union.[PIN| |See Bazelon et al (2023) and Robinson (2023).] Finally, our proposals on the transformation of the international economic and financial system, including the creation of an international clearing union and the democratization of the governance and voting rules, are closely related to recent proposals made by a number of collective organizations around the world (including Progressive International).[PIN| |See the “Program of Action on the Construction of a New International Economic Order”, 2024. See also the work by Democracy International, the South Centre and the World Federalist Movement.]
 
Given the magnitude of the transformations described by the GJP (or by a similar platform or set of platforms with similar goals), it is clear that nothing can be achieved without a powerful citizen movement and a dense network of broad-based organizations (including labour unions, political parties, civic platforms and other collective initiatives) which are sufficiently well organized and effective at promoting broad institutional and policy changes. While political and electoral processes are obviously very important, the success of this movement will ultimately depend on a broader cultural and intellectual battle about the meaning of sufficiency, equality and prosperity, both in the South and in the North.

Collective Deliberation and Material Knowledge

Within this broader sociopolitical process, a better articulation between citizen knowledge and social science research should also play a critical role in the future. Economic and budgetary platforms cannot be left to discussion by small groups of experts and decision makers. They belong to all citizens and should be at the centre of democratic deliberation and confrontation. In this report, we have tried to show that it is possible and necessary to articulate material accounting (using the language of work hours, sectoral shares, education and health, input-output matrices, energy systems, GHG emissions, land use, forest cover, temperature rise, etc.) and monetary accounting (using the language of income and wealth scales between and within countries). We stress that our material accounting framework remains highly incomplete. In particular, there are other planetary boundaries beyond climate change (biodiversity loss, freshwater depletion, ocean acidification, mining extractivism, etc.), which are sometime more difficult to quantify, but which cannot be studied through decarbonization alone. These other boundaries should be explicitly included in our material accounting system in the future, together with monetary accounting.
 
Another equally important and arguably even more challenging objective is to link the language of macroeconomic accounting at the world and national level (both material and monetary) with the local experience and knowledge which citizens and workers from all countries and conditions accumulate regarding production techniques, labour and property relations, community involvement and environmental preservation. If both levels of knowledge are not reconciled and articulated together in order to feed collective mobilization, there is little chance that ambitious transformations will ever happen. In particular, we stress that our work relies on a relatively crude description of the production techniques and the possible changes in the technology and input-output matrices (which for the most past we project for the future on the basis of past trends).[5]  This severely limits our ability to properly analyse and discuss some of the most promising avenues for material footprint compression, including the adoption of production techniques using fewer material inputs but more human labour. This may apply to a number of old or new techniques in material sectors like agriculture, construction and manufacturing, as well as to supposedly immaterial sectors like education, culture and health, which could also use very different techniques and input structure in the future in order to truly reduce material footprint. We hope that the present work and future initiatives organized in the context of the Global Justice Project and other collective endeavors will contribute to this complex and crucial process.

References

Abdelal, R. (2007). Capital Rules: The Construction of Global Finance. Harvard University Press.

Alvaredo, F., Chancel, L., Piketty, T., Saez, E & Zucman, G. (2018). World Inequality Report 2018. World Inequality Lab.

Amin, Samir (1973). Le développement inégal. Minuit Paris.

Andreescu, M., Arias-Osorio, et al. (2025). Equality and development: A comparative and historical perspective, 1800–2025. World Inequality Lab Working Paper 2025/25.

Andreescu, M., Loubes, R., Piketty, T., & Robilliard, A.-S. (2025). Global labour hours in paid and unpaid work: Productivity and structural transformation, 1800–2100. World Inequality Lab Working Paper 2025/08.

Arruza, C., Bhattacharya, T., & Fraser, N. (2019). Feminism for the 99%: A Manifesto. Verso.

Aura, S. (2005). Does the balance of power within a family matter? The case of the Retirement Equity Act. Journal of Public Economics, 89, 1699–1717.

Balboni, C., Bandiera, O., Burgess, R., Ghatak, M., & Heil, A. (2022). Why do people stay poor? Quarterly Journal of Economics, 137(2), 785–844.

Banerjee, A., Duflo, E., & Sharma, G. (2021). Long-term effects of the Targeting the Ultra Poor program. American Economic Review: Insights, 3(4), 471–486.

Banerjee, A., Gertler, P., & Ghatak, M. (2002). Empowerment and efficiency: Tenancy reform in West Bengal. Journal of Political Economy, 110(2), 239–280.

Banerjee, A., & Iyer, L. (2005). History, institutions, and economic performance: The legacy of colonial land tenure systems in India. American Economic Review, 95(4), 1190–1213.

Bauluz, L., Brassac, P., Dietrich, J., Martínez-Toledano, C., Nievas, G., Odersky, M., Piketty, T., Sodano, A., & Somanchi, A. (2025). Global wealth accumulation and ownership patterns, 1800–2025. World Inequality Lab Working Paper 2025/22.

Bazelon, C., Vargas, A., Janakiraman, R., & Olson, M. (2023). Quantification of reparations for transatlantic chattel slavery. In Report on Reparations for Transatlantic Chattel Slavery in the Americas and the Caribbean. University of West Indies (Center for Reparations Research) and American Society for International Law.

Beckert, S. (2014). Empire of Cotton: A Global History. Alfred A. Knopf.

Bengtsson, E. (2018). The Swedish Sonderweg in question: Democratization and inequality in comparative perspective, c. 1750–1920. Past and Present.

Bharti, N. K., & Yang, L. (2024). The making of India and China in the 21st century: Long-run human capital accumulation from 1900 to 2020. World Inequality Lab Working Paper 2024/24.

Bharti, N., Gethin, A., Jenmana, T. M., Mo, Z., Piketty, T., & Yang, L. (2026). Human capital, unequal opportunities and productivity convergence: A global historical perspective, 1800–2100. Journal of Public Economics, 255, 105578. https://doi.org/10.1016/j.jpubeco.2026.105578

Blanchet, T., Chancel, L., & Gethin, A. (2022). Why is Europe more equal than the United States? American Economic Journal: Applied Economics, 14(4), 480–518.

Bothe, P., Chancel, L., Dietrich, J., Druschke, P., Mohren, C., Nievas, G., Odersky, M., Piketty, T., & Somanchi, A. (2026). The Global Justice Platform: Distributional pathways, the Global Justice Fund and the new democratic international order, 2026–2100. World Inequality Lab Working Paper 2026/11.

Bothe, P., Chancel, L., Gethin, A., & Mohren, C. (2025). Global income inequality by 2050: Convergence, redistribution, and climate change. World Inequality Lab Working Paper 2025/09.

Bourguignon, F. and Morrisson, C. (2002) Inequality Among World Citizens: 1820-1992, American Economic Review

Bozio, A., Garbinti, B., Goupille-Lebret, J., Guillot, M., & Piketty, T. (2024). Predistribution vs redistribution: Evidence from France and the US. American Economic Journal: Applied Economics, 16(2), 31–65.

Brandt Commission. (1980). North–South: A Programme for Survival. Report of the Independent Commission on International Development Issues. MIT Press.

Brassac, P. (2026). Taxing wealth & enrichment: Lessons from the 1945 French National Solidarity Levy (ISN). World Inequality Lab Working Paper 2026.

Bridgetown Initiative (2024). Bridgetown Initiative on the International Development and Climate Finance Architecture, version 3.0.

Buchner, B., Naran, B., Padmanabhi, R., Stout, S., Strinati, C., Wignarajah, D., Miao, G., Connolly, J., & Marin, N. (2023). Global Landscape of Climate Finance 2023. Climate Policy Initiative.

Cagé, J. (2020). The Price of Democracy: How Money Shapes Politics and What to Do About It. Harvard University Press.

Cagé, J. (2024). Political inequality. Annual Review of Economics (World Inequality Lab Working Paper 2023/22).

Cagé, J., & Piketty, T. (2025). A History of Political Conflict: Elections and Social Inequalities in France, 1789–2022. Harvard University Press.

Callahan, C. W., & Mankin, J. S. (2022). National attribution of historical climate damages. Climatic Change.

Cappelen, A., Støstad, M., & Tungodden, B. (2025). Majority in 40 Countries Support Unprecedented Coordinated Billionaire Tax Discussed by G20. NHH.

Chancel, L. (2025). Énergie et inégalités: Une histoire politique. Éditions du Seuil.

Chancel, L., & Mohren, C. (2025). Climate Inequality Report 2025: Climate Change as a Capital Challenge. Why Climate Policy Must Tackle Ownership. World Inequality Lab.

Chancel, L., & Piketty, T. (2021). Global income inequality, 1820–2020: The persistence and mutation of extreme inequality. Journal of the European Economic Association, 19(6), 3025–3062.

Chancel, L., Gomez-Carrera, R., Moshrif, R., & Piketty, T. (2026). World Inequality Report 2026. World Inequality Lab.

Chancel, L., Mohren, C., Odersky, M., Piketty, T., & Somanchi, A. (2026). Prosperity within limits? Planetary habitability, global convergence and structural transformation, 2026–2100. World Inequality Lab Working Paper 2026/03.

Chancel, L., Piketty, T., Saez, E., & Zucman, G. (2022). World Inequality Report 2022. World Inequality Lab.

Climate Policy Initiative. (2025). Global Landscape of Climate Finance 2025.

Davidson, P. (2002). Financial Markets, Money and the Real World. Edward Elgar.

Davidson, P. (2004). A Post Keynesian view of the Washington consensus and how to improve it. Journal of Post Keynesian Economics, 27(2), 208–230.

De Schutter, O., The Roadmap for Eradicating Global Poverty Beyond Growth, Report of the Special Rapporteur on Extreme Poverty and Human Rights, United Nations General Assembly, 2026

Dixson-Declève, S., Gaffney, O., Ghosh, J., Randers, J., Rockström, J., and Stoknes, P.E., Earth for All: A Survival Guide for Humanity, New Society Publishers, 2022.

Dooley, K., Christoff, P., & Nicholas, K. A. (2021). Co-producing climate policy and negative emissions: Trade-offs for sustainable land-use. Global Sustainability, 4, e3.

Dorninger, C., Hornborg, A., Abson, D. J., von Wehrden, H., Schaffartzik, A., Giljum, S., Engler, J.-O., Feller, R. L., Hubacek, K., & Wieland, H. (2021). Global patterns of ecologically unequal exchange: Implications for sustainability in the 21st century. Ecological Economics, 179, 106824. https://doi.org/10.1016/j.ecolecon.2020.106824

Druschke, P., & Nievas, G. (2026). The global democratic deficit: Institutional asymmetries and the provision of global public goods. World Inequality Lab Working Paper.

Eichengreen, B. (1990). The capital levy in theory and practice. In R. Dornbusch & M. Draghi (Eds.), Public Debt Management: Theory and History (pp. 191–220). Cambridge University Press.

EEB. (2024). Manifesto: A Resilient and Resource-wise Europe: Sufficiency at the Heart of the EU’s Future. European Environmental Bureau (EEB).

Ewing, K., Hendy, G., & Jones, C. (2018). Rolling Out the Manifesto for Labour Law. Institute for Employment Rights.

Fabre, A. (2024). A global climate plan. CIRED.

Fabre, A. (2025). Public acceptance of international redistribution in high-income countries. World Inequality Lab Working Paper 2025.

Fabre, A. (2026). From global policies to phase out fossil fuels in a sustainable union. CIRED.

Fabre, A., Douenne, T., & Mattauch, L. (2025). Majority support for global redistributive and climate policies. Nature Human Behavior.

Fabre, A., Arezki, R., Dasgupta, D., Hu, B., Sen, P., & van der Ploeg, F. (2026). An international plan for sustainable development. Ecological Economics.

Fanning, Andrew L and Jason Hickel (2023). « Compensation for atmospheric appropriation. » Nature sustainability 6.9, pp. 1077–1086.

Ferreras, I., Battilana, J., & Méda, D. (2022). Democratize Work: The Case for Reorganizing the Economy. University of Chicago Press.

Ferreras, I., et al. (2026). Two Promises to Those Who Work: Voice and Ownership. Final Report of the International High-Level Expert Committee on Democracy at Work. Madrid: Ministerio de Trabajo y Economía Social.

Gáspár, J.; Köves, A.; Hirvilammi, T., Hideg, É.; Ding, J.; Márton, A.; Szathmári, A.; Kiss, G.; Csuport, Zs.; Fischer, M. Post-growth Futures Report. The MAPS Project, Corvinus University of Budapest, Budapest, Hungary, 2025.

Gethin, A., Martínez-Toledano, C., & Piketty, T. (Eds.). (2021). Political Cleavages and Social Inequalities: A Study of 50 Democracies, 1948–2020. Harvard University Press.

Greenwald, B., & Stiglitz, J. E. (2010). A modest proposal for international monetary reform. In S. Griffith-Jones, J. A. Ocampo, & J. E. Stiglitz (Eds.), Time for a Visible Hand: Lessons from the 2008 World Financial Crisis. Oxford University Press.

Guinan, J., & O’Neill, M. (2020). The Case for Community Wealth Building. Cambridge University Press.

Haberl, H., Wiedenhofer, D., Virág, D., et al. (2020). A systematic review of the evidence on decoupling of GDP, resource use and GHG emissions, Part II: Synthesizing the insights. Environmental Research Letters, 15(6), 065003. https://doi.org/10.1088/1748-9326/ab842a

Hassani, A., La justice du capital. Quand les multinationales (dé)font la loi. La fabrique, 2025

Henriques, S. T., & Kander, A. (2010). The modest environmental relief resulting from the transition to a service economy. Ecological Economics, 70(2), 271–282.

Hickel, J. (2021). Less Is More: How Degrowth Will Save the World. Windmill Books / Penguin Random House.

Hickel, J., & Kallis, G. (2020). Is green growth possible? New Political Economy, 25(4), 469–486. https://doi.org/10.1080/13563467.2019.1598964

Hickel, J., Sullivan, D., & Zoomkawala, H. (2021). Plunder in the post-colonial era: Quantifying drain from the global South through unequal exchange, 1960–2018. New Political Economy, 26(6), 1030–1047.

Hughes, M. (1999). Shouldering the Burden of Defeat: West Germany and the Reconstruction of Social Justice. University of North Carolina Press.

Intergovernmental Panel on Climate Change. (2023). Climate Change 2023: Synthesis Report. Contribution of Working Groups I, II and III to the Sixth Assessment Report of the Intergovernmental Panel on Climate Change (H. Lee & J. Romero, Eds.). IPCC. https://doi.org/10.59327/IPCC/AR6-9789291691647

International Energy Agency (2025), World Energy Outlook 2025. IEA

Jackson, T. (2017). Prosperity Without Growth: Foundations for the Economy of Tomorrow (2nd ed.). Routledge.

Jones, A. C., & Lawson, A. J. (2022). Carbon Capture and Sequestration (CCS) in the United States (CRS Report R44902). Congressional Research Service.

Kaldor, N. (1955). An Expenditure Tax. George Allen & Unwin.

Kalecki, M., & Schumacher, E. F. (1943). International clearing and long-term lending. Bulletin of the Institute of Statistics Oxford, Supplement No. 5, Volume 5, 29–33. Reprinted in J. Osiatyński (Ed.), Collected Works of Michał Kalecki Volume VII: Studies in Applied Economics 1940–1967 Miscellanea. Clarendon Press, 1997.

Kallis, G. (2011). In defence of degrowth. Ecological Economics, 70(5), 873–880. https://doi.org/10.1016/j.ecolecon.2010.12.007

Kanitkar, T., & Jayaraman, T. (2019). Equity in long-term mitigation. In N. Dubash (Ed.), India in a Warming World: Integrating Climate Change and Development (pp. 92–113). Oxford University Press.

Kanitkar, T., Mythri, A., & Jayaraman, T. (2024). Equity assessment of global mitigation pathways in the IPCC Sixth Assessment Report. Climate Policy, 24(8), 1129–1148. https://doi.org/10.1080/14693062.2024.2319029

Kanitkar, T., Jayaraman, T., & Lavanyaa, V. P. (2026). Projected global and national energy and climate futures using an alternative integrated assessment framework. npj Climate Action5, 41. https://doi.org/10.1038/s44168-026-00368-0

Kari, S., & Holappa, L. (2026). Resolving the balance of payments problematic: Feasible reforms for the twenty-first century. In J. Morgan & H. Patomäki (Eds.), Deweaponizing Interdependence: Bringing the Idea of International Clearing Union into the Twenty-First Century. Palgrave Macmillan.

Keller, S. (2026). Terms of trade and North-South trade relations: Implications for foreign wealth accumulation and comparative development (1962–2025). World Inequality Lab Working Paper 2026/04.

Keynes, J. M. (1943). Proposals for an international clearing union. The Collected Writings of John Maynard Keynes, 25, 168–96.

Keyßer, L. T., & Lenzen, M. (2021). 1.5°C degrowth scenarios suggest the need for new mitigation pathways. Nature Communications, 12, 2676. https://doi.org/10.1038/s41467-021-22884-9

Leech, D. (2002). Voting power in the governance of the International Monetary Fund. Annals of Operations Research, 109(1), 375–397.

Lefèvre, J., Le Gallic, T., Fragkos, P., Mercure, J.-F., Simsek, Y., & Paroussos, L. (2022). Global socio-economic and climate change mitigation scenarios through the lens of structural change. Global Environmental Change, 74, 102510. https://doi.org/10.1016/j.gloenvcha.2022.102510

Mager, F. (2025), Reclaiming Tax Sovereignty to Transform Global Climate Finance, Tax Justice Network

Martinez-Alier, J. (2002). The Environmentalism of the Poor: A Study of Ecological Conflicts and Valuation. Princeton University Press.

McGaughey, E. (2017a). A twelve-point plan for labour, and a manifesto for labour law. Industrial Law Journal.

McGaughey, E. (2017b). The codetermination bargains: The history of German corporate and labour law. Columbia Law Review.

McGaughey, E. (2025). Is public ownership of privatization better? Law, economic theories and how data helps. World Inequality Lab Working Paper 2025/18.

Millward-Hopkins, J., & Oswald, Y. (2023). Reducing global inequality to secure human wellbeing and climate safety: a modelling study. Lancet Planetary Health7(2), e147–e154. https://doi.org/10.1016/S2542-5196(23)00004-9

Morgan, J., & Patomäki, H. (Eds.). (2026). Deweaponising Interdependence: Bringing the Idea of International Clearing Union into the 21st Century. Palgrave Macmillan.

Nievas, G., & Piketty, T. (2025). Unequal exchange and North-South relations: Evidence from global trade flows and the world balance of payments 1800–2025. World Inequality Lab Working Paper 2025/11.

Nievas, G., & Sodano, A. (2024). Has the US exorbitant privilege become a rich world privilege? Rates of return and foreign assets from a global perspective, 1970–2022. World Inequality Lab Working Paper 2024/14.

Nogues-Marco, P. (2021). Measuring colonial extraction: The East India Company’s rule and the drain of wealth (1757–1858). Capitalism: A Journal of History and Economics, 2(1), 154–195.

Nordhaus, W. (2015), Climate Clubs: Overcoming Free-Riding in International Climate Policy, American Economic Review, vol. 105, no. 4, April 2015

Ocampo, J. A. (2010). Reforming the global reserve system. In S. Griffith-Jones, J. A. Ocampo, & J. E. Stiglitz (Eds.), Time for a Visible Hand: Lessons from the 2008 World Financial Crisis. Oxford University Press.

Odersky, M. (2025). Structural transformation and the climate crisis: The sluggish global industry composition and its impact on emissions, 1970–2025 (MSc thesis). Paris School of Economics.

O’Neill, B. C., Kriegler, E., Riahi, K., et al. (2014). A new scenario framework for climate change research: The concept of shared socioeconomic pathways. Climatic Change, 122, 387–400. https://doi.org/10.1007/s10584-013-0905-2

Oreskes, N. (2024). The false promise of carbon capture as a climate solution. Scientific American.

Oswald, Y., & Millward-Hopkins, J. (2025). The carbon emissions of global income convergence scenarios. SSRN Working Paper. https://doi.org/10.2139/ssrn.5333077

Parrique, T., Barth, J., Briens, F., Kerschner, C., Kraus-Polk, A., Kuokkanen, A., & Spangenberg, J. H. (2019). Decoupling Debunked: Evidence and Arguments Against Green Growth as a Sole Strategy for Sustainability. European Environmental Bureau.

Parthasarathi, P. (2011). Why Europe Grew Rich and Asia Did Not: Global Economic Divergence 1600–1850. Cambridge University Press.

Patnaik, U., & Patnaik, P. (2021). Capital and Imperialism: Theory, History and the Present. Monthly Review Press.

Piketty, T. (2014). Capital in the 21st Century. Harvard University Press.

Piketty, T. (2020). Capital and Ideology. Harvard University Press.

Piketty, T. (2022). A Brief History of Equality. Harvard University Press.

Piketty, T. (2025). Toward ecological socialism. In Equality Is a Struggle: Bulletins from the Front Line 2021–2025. Yale University Press.

Piketty, T., & Saez, E. (2013). Optimal taxation of labor income. In Handbook of Public Economics (Vol. 5, Chap. 7, pp. 391–474). North-Holland.

Piketty, T., Saez, E., & Stantcheva, S. (2014). Optimal taxation of top labor incomes: A tale of three elasticities. American Economic Journal: Economic Policy, 6(1), 230–271.

Polanyi, K. (1944). The Great Transformation. Farrar & Rinehart.

Pomeranz, K. (2000). The Great Divergence: China, Europe and the Making of the Modern World Economy. Princeton University Press.

Progressive International. (2024). Program of Action on the Construction of a New International Economic Order.

Rapkin, D. P., & Strand, J. R. (2006). Reforming the IMF’s weighted voting system. World Economy, 29(3), 305–324.

Rawls, J. (1971). A Theory of Justice. Harvard University Press.

Riahi, K., van Vuuren, D. P., Kriegler, E., et al. (2017). The shared socioeconomic pathways and their energy, land use, and greenhouse gas emissions implications: An overview. Global Environmental Change, 42, 153–168.

Richardson, K., Steffen, W., Lucht, W., Bendtsen, J., Cornell, S. E., Donges, J. F., Drüke, M., Fetzer, I., Bala, G., von Bloh, W., Feulner, G., Fiedler, S., Gerten, D., Gleeson, T., Hofmann, M., Huiskamp, W., Kummu, M., Mohan, C., Nogués-Bravo, D., Petri, S., Porkka, M., Rahmstorf, S., Schaphoff, S., Thonicke, K., Tobian, A., Virkki, V., Wang-Erlandsson, L., Weber, L., & Rockström, J. (2023). Earth beyond six of nine planetary boundaries. Science Advances, 9(37).

Robeyns, I. (2024). Limitarianism: The Case Against Extreme Wealth. Penguin Books.

Robinson, P. (2023). Introduction. In Report on Reparations for Transatlantic Chattel Slavery in the Americas and the Caribbean. University of West Indies (Center for Reparations Research) and American Society for International Law.

Sandberg, M. (2021). Sufficiency transitions: A review of consumption changes for environmental sustainability. Journal of Cleaner Production, 293, 126097.

Sen, A. (1979). Equality of what? The Tanner Lecture on Human Values, Stanford University.

Slameršak, A., Fisch-Romito, V., Hickel, J., Kikstra, J. S., Millward-Hopkins, J., Oswald, Y., & Steinberger, J. (2026). Principles for a post-growth scenario of ambitious mitigation and high human well-being. Nature Climate Change16, 405–415. https://doi.org/10.1038/s41558-026-02580-6

Stern, D. I. (2004). The rise and fall of the environmental Kuznets curve. World Development, 32(8), 1419–1439.

Stiglitz, J. E. (2010). The Stiglitz Report: Reforming the International Monetary and Financial Systems in the Wake of the Global Crisis. The New Press.

Tcherneva, Pavlina R (2020). The case for a job guarantee. John Wiley & Sons.

van Waijenburg, M. (2018). Financing the African colonial state: The revenue imperative and forced labor. Journal of Economic History.

Vestergaard, J., & Wade, R. H. (2013). Protecting power: How Western states retain the dominant voice in the World Bank’s governance. World Development, 46, 153–164.

Vogel, J., Steinberger, J. K., O’Neill, D. W., Lamb, W. F., & Krishnakumar, J. (2021). Socio-economic conditions for satisfying human needs at low energy use: An international analysis of social provisioning. Global Environmental Change, 69, 102287. https://doi.org/10.1016/j.gloenvcha.2021.102287

Wiedmann, Thomas et al. (2020). « Scientists’ warning on affluence. » Nature communications 11.1, p. 3107.

Wiedmann, T. O., Schandl, H., Lenzen, M., Moran, D., Suh, S., West, J., & Kanemoto, K. (2015). The material footprint of nations. Proceedings of the National Academy of Sciences, 112(20), 6271–6276. https://doi.org/10.1073/pnas.1220362110

Zimm, C., Mintz-Woo, K., Brutschin, E., Hanger-Kopp, S., Hoffmann, R., Kikstra, J. S., … & Schinko, T. (2024). Justice considerations in climate research. Nature Climate Change, 14(1), 22–30.

Zucman, G. (2024). A Blueprint for a Coordinated Minimum Effective Taxation Standard for Ultra-High-Net-Worth Individuals. Report Commissioned by the Brazilian G20 Presidency.

Introduction: Justice as Participation and Deliberation

What is a just society, a just world, a just planet? In this report, we attempt to describe how a world committed to global socioeconomic justice and planetary habitability could look by 2100 – in particular, the distribution of economic and environmental resources within and between countries, including access to education, health, material goods, income, wealth, and political voice. We also lay out a plausible and fully quantified transition path to get there from 2026 to 2100

Over the course of the 20th century, several countries were able to reduce social inequalities significantly (via the development of social-democratic welfare states, public education and health, progressive taxation of income and wealth, social security systems, labour law and democratic rights) while at the same time achieving unprecedented levels of economic prosperity. This historical trend toward equality, social inclusiveness, and prosperity, however, has been interrupted (and, in some cases, partly reversed) since the 1980s-1990s. Moreover, this long-run evolution has been largely confined to a subset of rich nation-states in the North, particularly in Western and Nordic Europe, while largely overlooking enormous North-South inequalities. This is even more problematic given that the Western enrichment could never have taken place without very strong international integration and without the brutal exploitation of the natural and human resources available on a global scale, resulting in massive human suffering and unprecedented environmental damage. While there are many positive lessons to be drawn from the reduction of inequality and the construction of social-national states in Western and Nordic Europe, as well as from successful development experiences in all parts of the world, a more ambitious social-internationalist and planet-conscious agenda is now needed in order to pursue the movement toward equality at a global level and to confront the existential challenges of global warming and planetary habitability.  

Defining Global Socioeconomic Justice

The Global Justice Project aims to draw lessons from past experiences to describe what a just distribution of income, wealth, and other socioeconomic and environmental resources could look like at the global level in the 21st century and how it could be achieved. For the purposes of this report, we will use the following imperfect definition of justice. A just society is one that allows all its members to have access to the widest possible range of fundamental goods. Fundamental goods include education, health, housing, food, culture, a sustainable and biodiverse planet, and economic and political voice, i.e., effective participation in democratic deliberation and decision-making in social, cultural, economic, civic, and political life. A just society organises socioeconomic relations, property rights, and the distribution of income and wealth in such a way that allows its least advantaged members to enjoy the highest possible life conditions and to participate effectively in all aspects of social life.
 
First and foremost, a just society and a just world depend on the empowerment of all strata of society, beginning with its most disadvantaged and powerless members, both at the global and national levels. A just society in no way requires absolute uniformity or equality. To the extent that income and wealth inequalities are the result of different aspirations and distinct life choices, or permit improvement of the standard of living and expansion of the opportunities available to the disadvantaged, they may be considered just. But this must be demonstrated, not assumed. Importantly, this argument cannot be invoked to justify any degree of inequality whatsoever, as is too often done by privileged social groups, most of the time without acknowledging the successful historical movement toward equality which we observe in some of the world’s most prosperous countries over the long run. In addition, this deliberative process must focus on the global ecological footprint, especially given the global origins and extractive dimensions of modern enrichment.  
 
This imprecise definition of a just society is far from resolving all the issues. But going further requires collective deliberation informed by each citizen’s historical and social experience, with participation from all members of society. That is why participation and deliberation are both ends and means. The definition is nevertheless useful because it allows us to lay down certain principles. In particular, equality of access to fundamental goods must be absolute: one cannot offer greater political participation, extended education, or higher income to certain groups while depriving others of their right to vote, attend school, or receive health care. Where do fundamental goods such as education, health, planetary habitability, housing, culture, etc., start, and where do they end? That is obviously a matter for debate and cannot be decided without extensive democratic and collective deliberation. This also requires us to permanently question all forms of received wisdom about the socioeconomic order and to take a fresh look at all collective and historical experiences that have tried to redefine and reshape existing institutional arrangements and property regimes[PIN| |This view of socioeconomic justice as participation, deliberation and confrontation combines the insights of multiple lines of thoughts (including Rousseau, Marx, Durkheim, Keynes, Rawls and Sen).  See T. Piketty, Capital and Ideology, chapter 17, HUP 2020; A Brief History of Equality, HUP 2022.].

In the context of this complex and collective political process, we believe that it is useful and appropriate for a team of researchers who have been closely involved in the historical and comparative analysis of inequality and development to contribute to this discussion and deliberation. In the Global Justice Report, we aim to draw lessons from our research and to set some quantitative targets about global socioeconomic justice, which we formulate both in terms of material accounting (work hours, sectoral shares, education/health, energy systems, GHG emissions, land use, forest cover, temperature rise, etc.) and monetary accounting (income and wealth scales between and within countries).

More precisely, we describe plausible and desirable future scenarios that combine two key goals: socioeconomic equality (including full economic equality between countries, full gender equality in labour hours and pay, sharp compression of within country income and wealth scales, combined with fair access to education, healthcare and effective participation in all aspects of social, economic, cultural and political life); and planetary habitability (aligning global resource use within ecological boundaries, in particular, limiting global temperature increase below 2°C). We analyze various combinations of global- and country-level policies and institutional transformations to implement these outcomes. 

We are aware that the dimensions of global justice addressed here cover only a subset of what a comprehensive global justice platform should entail. In addition, setting precise quantitative targets for socioeconomic justice always entails significant oversimplification. National accounting and country-level statistics inevitably smooth over local living standards, individual differences, and the full complexity of human well-being. Practical policy implementation and real-world institutional change always involve complex, multidimensional transformations and shifting power relations among social groups. The success or failure of such transformations generally depends on myriad factors that cannot be fully captured or adequately appreciated by quantitative targets and macro-level accounting.  At the same time, we believe that this kind of quantitative framework can play a useful role in the public discussion, as long as we recognize the limitations of this type of language and its complementarity with other forms of arguments and modes of expressions.

Participation & Deliberation vs Crisis & Catastrophes in the History of Equality

In the past, the march toward equality did not always happen in peace. It did not emerge as the steady outcome of a quiet process based upon well-organized collective participation and democratic deliberation. Social struggles and popular mobilizations have been at the forefront of the long run movement towards greater political and socioeconomic equality over the past 250 years, from the revolutionary events of the late 18th century to the social movements of the early 21st century. In effect, social struggles should be regarded as among the most effective forms of political participation, alongside electoral processes.

In some cases, crises, wars, and catastrophes of all sorts also played a crucial role in accelerating political change and institutional transformations. To some extent, the emergence of egalitarian and prosperous social-democratic societies in Western Europe in the 20th century was facilitated – and possibly accelerated – by the violent fall of previous elites and power regimes and by the cataclysmic damages produced by the nationalist, colonialist, and extractive ideologies on which they were based. It is likely that other crises and catastrophes – including climate and environmental disasters, and new nationalist rivalries and conflicts over resources – will also play a critical role in the future, perhaps on a truly global scale this time.

In the Ministry of the Future, science-fiction author Kim Stanley Robinson imagines a world where major climate catastrophes occur – including a heatwave that kills millions in Uttar Pradesh and a coalition of eco-activists shooting airplanes – before public opinion, governments and international organizations alike finally decide to transform our economic and political systems. The real-world geopolitical clashes over territories and resources unfolding in the 2020s – with a return to earlier forms of extractive gestures, from Ukraine to Greenland, Panama, Venezuela, and Iran – might also help convince citizens around the world that the current international system leads to dead ends and needs a serious reset.

We certainly cannot predict which catastrophes or sequences of events will lead to political and socioeconomic change in the future. We are also very much aware of the tragic and violent nature of history. But at the same time, we also know that participation and deliberation will matter in all possible trajectories. Waiting for crises and cataclysms to impose radical changes is not enough – especially if the nature of the radical changes that we aspire to is not well-defined. One of the key lessons from the history of equality – from the Enlightenment in the 18th century to the Social-Democratic Revolution of the 20th century – is that political ideas and policy platforms do matter. The sole ambition of the Global Justice Platform is to participate in this collective deliberative process by proposing one quantitatively and institutionally grounded, if necessarily incomplete, step in that direction. We hope it stimulates other contributions and discussions.

Chapter 4. Political Strategies: Rebuilding Majorities for Equality

The Global Justice Platform – or any similar program aiming to reconcile global equality and planetary habitability – is likely to be met with significant political resistance, coming not only from the global rich, but also from broader segments of the population, both in the North and in the South. In order to confront this challenge, it is critical to break with the illusion of “classless ecology” and to prioritize the promotion of socioeconomic equality and labour rights along with environmental goals (Chap. 4.1-4.2). It is also crucial to stress the complementarity between the logic of universal justice and that of reparatory justice at work in the GJP (Chap. 4.3-4.4) and the need to scale up the GJP to fully address the issue of historical responsibilities (Chap. 4.5). Finally, we discuss the conditions under which the GJP can be achieved with an incomplete coalition of countries, including without the US and/or China (Chap. 4.6), and the difficult question of the right level of gradualism vs. radicalism (Chap. 4.7).[PIN| |This Chapter aims to synthetize some of the material that is presented in a more detailed manner in Bothe et al (2026). We refer all interested readers to this work and to the online replication package.]

4.1 Setting Priorities: Socioeconomic Equality and Labour Rights

Political opposition to the Global Justice Platform is likely to be particularly strong among the global rich, who are clear monetary losers from the GJP – and arguably from any other plausible plan trying to reconcile development goals and climate objectives. A fraction of them might realize that global sustainable convergence and the preservation of planetary habitability are more important than their monetary losses. But many of them – billionaires, centimillionaires, and decamillionaires combined – will spend enormous resources in order to convince large fractions of the population that they will lose from the Global Justice Platform.[PIN| |See e.g. the strong mobilization of billionaires against California’s 5% billionaire tax initiative (2026).] There is no magic bullet to address this issue, except trying to be more convincing and as precise as possible regarding the benefits of the GJP, in particular the value of sufficiency, planetary habitability and global convergence, and the fact that the vast majority of the population (about 95-98% in the South and 85-95% in the Global North) will benefit from rising monetary incomes over the 2026-2100 period. Most importantly, nothing can be achieved without a powerful citizen movement and a network of broad-based organizations (including labour unions and political parties) which are sufficiently well organized and effective at promoting the Global Justice Platform (or a similar platform or set of platforms with similar goals). While direct political and electoral processes are central, the success of the GJP will ultimately depend on a broader cultural and intellectual battle about the meaning of sufficiency, equality and prosperity.
 
One difficulty that deserves special attention is the following. For too long, environmental policies did not pay much attention to social inequalities. In many cases, the rhetoric of “classless ecology” and “green growth” – i.e. the idea that it is possible to address environmental challenges by indefinitely increasing the size of the pie and without addressing explicitly the issues of sufficiency and inequality between social classes, neither in terms of unequal responsibilities nor unequal damages – has been routinely used to promote anti-redistributive and inequality-enhancing policies.
 
One caricatural example is the large carbon tax hike that was scheduled in France in 2018. This was a strongly regressive tax (including a high tax burden for average workers using their car to go to work on a daily basis, but full exemption for the kerosene used by those taking airplanes for a week-end), and the revenues were used to finance the wealth tax repeal which was being implemented the very same year (to the benefit of the top 1% taxpayers). This led to massive popular protests – the so-called “yellow vests” movement – so that ultimately the carbon tax hike was abandoned (but the wealth tax repeal was maintained). In practice, “classless ecology” often looks a lot like a mixture of pro-rich ecology and business-friendly greenwashing, i.e. an attempt by free-market liberals to pretend that they are doing something about global warming and planetary habitability while maintaining basically the same neoliberal, productivist policies.
 
A similar but distinct dynamic played out in Ecuador in 2019, when the government announced the removal of longstanding fuel subsidies as part of an IMF-backed austerity package. The subsidies were environmentally problematic, but their removal fell hardest on poor and working-class populations, and particularly on indigenous communities, who depended on affordable fuel for transport and livelihoods. The result was weeks of mass protests led by Indigenous organizations, which forced the government to reverse course. This case shows how countries with limited fiscal space are pressured by international financial institutions into reforms whose burden falls on the poorest. Without the reforms of the international order described above, and without an ambitious platform to reduce socioeconomic inequalities, even well-intentioned environmental policies risk being imposed on those least able to bear their costs and least responsible for the problem in the first place.
 
These kinds of events have contributed to giving mainstream environmental policies a bad name among large segments of lower- and middle-income groups, both in the North and in the South. Most of the time, green policies have been conducted without any explicit consideration for the unequal situation of the various social classes – and especially the enormous responsibilities of the richest classes in environmental degradations. Electoral data shows that green parties generally obtain particularly low scores among low-income voters.[PIN| |See Cagé and Piketty, 2025, Figures 12.23-12.24.] Contrary to what is sometime posited, this is not due to the fact that the planet is a luxury good which the poor cannot afford and/or do not care about. If anything, the poorest social classes – both at the world level and within each country – are those who are suffering the most from environmental damages and temperature rise, and who have developed the strongest grassroot mobilisations in order to oppose ongoing degradations.[PIN| |See the pioneering work of Martinez-Allier (2002) on the “environmentalism of the poor”.] The problem is that most governments since the 1980s-1990s – whether they come from the centre-left or the centre-right – have been following neoliberal policies based on the premise that economic deregulation and capital flows liberalization can solve all problems.[PIN| |See Abdelal (2007).] They did not pay much attention to rising social inequalities in general, and in particular to the class dimension of environmental policies. The perception that mainstream green policies are inherently anti-poor and do not ask their fair share to the richest groups is now so entrenched that there is arguably no easy way out.
 
In our view, the only solution is to break away in a very clear and visible manner from the illusion of “classless ecology” and to prioritize the promotion of socioeconomic equality and worker rights along with environmental goals. In the Global Justice Platform, ambitious quantified targets on GHG emissions and temperature rise come together with similarly ambitious quantified goals on education and health expenditures, rising incomes and wages for the bottom 80-90% and a sharp compression of the distribution of income, wealth and power in all countries. The financing of the platform falls entirely on the global rich, again with fully specified trajectories regarding tax rates and revenues, investment flows and country dividends. By providing a fully specified redistributive programme which breaks deliberately and abruptly with decades of neoliberalism, the GJP aims to transform popular perceptions about equality and ecology. Whether this will suffice – and how much this needs to be amended – largely depends on the political strategies that will be followed at the local and national levels.

4.2 Reconciling the Global, the National and the Local Perspectives

By cutting across country lines and replacing them by internationalist class lines, the Global Justice Platform has the potential to generate large majority approval in all countries. In practice, the main challenge which political parties and other collective organizations supporting the GJP – or any similar platform – will have to confront is to reconcile the global, the national and the local perspectives. The global objectives offered by the GJP – e.g. regarding GHG emissions, temperatures, global wealth taxation or the World Sovereign Fund – can be an asset in a political campaign, but they can also seem somewhat abstract and distant. In order to make the GJP more concrete, it is critical to emphasize – and illustrate with examples – how country dividends can be used to finance education and health expenditures at the local level and how WSF investment flows can help finance energy and transportation infrastructures and create sustainable jobs in specific municipalities.
 
One central difficulty is that it might take a while before the GJP can fully materialize. In the meantime, it is critical that parties and organizations supporting the GJP are able to put in place successful redistributive policies at the national and local levels. The ideal policy mix depends on the specific political and socioeconomic context of each country, and a complete analysis of such country-level policy platforms goes well beyond the scope of this report. One general issue which deserves particular attention is the fact that rising social inequalities since the 1980s-1990s have been accompanied in many countries by the return of large territorial divides, especially between small cities and large agglomerations. This follows from multiple factors, including unequal access to universities, health, transport, and other public services between territories, as well as differences in sectoral and occupational structures and trade exposures. This has contributed to a more general transformation in the structure of electoral cleavages, including a gradual disconnection between income, property, and education divides, as well as a rising political division between the rural poor and the urban poor, at levels unseen for a century.[PIN| |See Gethin, Martinez-Toledano and Piketty (2021) and Cagé and Piketty (2025). In practice, the growing disconnection between property and education divides is closely related to rising territorial divides, as it is relatively easier to access property ownership in small cities and rural areas and to access universities in large agglomerations, with a growing gap in recent decades.] Reducing these territorial divides is a critical step in the reconstruction of political majorities in favour of equality. Probably the best tool to achieve this goal is a massive investment plan to improve access to high-quality public services for lower- and middle-income households, both in small cities and rural areas and in Iarge agglomerations. Top-end progressive taxation of income and wealth plays a key role here, both to finance new public expenditure and to improve access of modest households to housing and credit.[PIN| |E.g. by cutting property taxes or other regressive taxes paid by lower- and middle-income households and/or via interest-free loans or capital endowments. See Piketty (2022) and Cagé and Piketty (2025).]          
 
Another area where national- and local-level policies can make a large difference has to do with workplace democracy, including increased voice for workers and improved opportunities to negotiate better wages and work conditions. For instance, the co-management rules that have been applied in Germany and Nordic Europe since 1950 (with up to 50% of voting rights for workers representatives in corporate boards in large companies) could be extended to all countries and companies.[PIN| |This could come together with a limitation of voting rights to 10% for individual shareholders in large corporations. See the discussion in Chapter 2.] In recent years, there has also been a new wave of innovative proposals on democracy at work,[PIN| |See in particular Ferreras et al (2022, 2026), McGaughey (2017a, 2017b) & Ewing et al (2018). See also Guinan and O’Neill (2020) on Meidner-type employee funds and community wealth and Tcherneva (2020) on job guarantee system operated by municipalities and non-profit organizations. This could be supplemented by wage funds receiving compulsory contributions from high-wage firms and transferring compensations to those with low wages. This is equivalent to progressive wage taxes and subsidies except that this is explicitly tied to decentralized decision-making processes and economic democracy. ] anti-discrimination rules and gender equality.[PIN| |See e.g. Arruza, Bhattacharya and Fraser (2019).] In the context of the GJP, policies aimed at reducing work hours and equalizing pay and labour time (economic and domestic) between women and men are projected to be addressed for the most part at the country level, and they will require very strong mobilization to be adopted, in line with historical experience. In addition, new policy tools are likely to be needed in order to rebalance power relations within households.[PIN| |See the discussion in Chapter 1.] Finally, the rewriting of existing rules regarding the financing of political campaigns and the governance of the media should also be viewed as top priorities for any meaningful change to take place, and this is again an area which is primarily handled at the national level (although global cooperation could also help).[PIN| |See Cagé (2020, 2024).]
 
To summarize, it is first and mostly through national-level and local-level policies that parties and organizations supporting the GJP – or any similar global platform – have a chance to win elections and remain in power, at least in the short run. That being said, it is also critical in our view that they support a global platform like the GJP, first because this will eventually bring additional fiscal resources to fund domestic expenditures and reduce inequality, and next and most importantly because this is the only way to address global development and planetary habitability concerns. Voters are now well aware that climate change cannot be properly handled by individual countries alone, and that low-development traps are not only unfair for those born in poor countries but also carry significant consequences for other countries (including migration pressures). Political parties, labour unions and other collective organizations need to take a credible stand on global development and climate change, trade agreements, and international relations, and more generally on the transformation of the global economic and financial system. For instance, trade treaties are permanently being renegotiated (most recently the EU-Mercosur agreement),[PIN| |Many European political parties, labour unions, and producers associations oppose this agreement on the basis of continuing deforestation taking place in Latin America. While this is understandable, it would be preferable in our view if this came with explicit proposals to create GJP-type global wealth and income taxes in order to finance an alternative development model (so that in effect Latin American countries are compensated for ending deforestation).] and annual COP meetings take place in the context of the UN Framework Convention on Climate Change (with multiple discussions and persistent North-South disagreements on the financing of adaptation and mitigation climate funds).[PIN| |Here again, the natural would be to propose GJP-type global taxes financing climate funds.] Supporting the GJP (or other platforms trying to combine domestic and global objectives) is complementary – not substitutable – to the pursuit of socioeconomic equality and labour rights at the local and national level. Not taking a stand on global issues is not an option.     
 
How long will it take before the Global Justice Platform (or a similar platform) can realistically be adopted and implemented? While we are not in a position to predict which popular mobilizations, environmental disasters, geopolitical crises or other sequences of events will lead to political change, several remarks are in order.
 
First, the Global Justice Platform can be implemented with an incomplete coalition of countries. It would obviously be preferable to have all countries on board. At the very least, the initial coalition should include some of the main countries from the North (especially the richest countries in Europe and East Asia) and from the South (e.g. Brazil, India, South Africa, Egypt, Nigeria, Turkey, Indonesia, etc.). However, if necessary, the GJP can also start without some of the largest countries, and in particular without the US and/or China. We will return to this discussion later.
 
In our benchmark scenario, we assume that the GJP begins to operate in 2026 and that the first country dividends are distributed in 2027. While this is technically possible, it is probably more realistic politically to imagine that it will take at least a few years to form a large North-South coalition, so that the starting date could be 2030 or 2035 or later. Postponing the starting date has relatively little impact on the general logic of the GJP or on the main orders of magnitudes regarding revenues and expenses. However, it does have a very large impact on projections for cumulated GHG emissions and global warming. The later the starting date, the more difficult it is to limit temperature rise below 2°C or even 2.5°C. Consequently, delaying action increases the importance of starting the process and scaling it up quickly to limit damages. In any case, the problems which the GJP is trying to solve are unlikely to go away by themselves. According to our simulations, temperature will rise beyond 4°C-4.5°C under the various alternative scenarios under consideration, implying very high probabilities of major climate catastrophes and tipping points.   
 
We also stress that the Global Justice Platform should not be viewed as an all-or-nothing platform. The magnitude of the Global Justice Fund and the Sovereign Wealth Fund have been set so as to reach the desired targets in terms global socioeconomic convergence (including adequate levels of education and health expenditure) and planetary habitability (temperature rise below 2°C). However, disagreements about these estimates and conclusions are perfectly acceptable, and it is obviously possible to promote certain aspects of the GJP and not others, or more generally to use the GJP as a toolbox (e.g. by using the global wealth tax to finance adaptation funds or compensations for reforestation in trade agreements). We will later return to the difficult question of the right level of gradualism and radicalism, which in our view is very much an open question. The most important issue is to be very clear and transparent about what can be achieved with the various policy platforms under consideration.  
 
Finally, we stress again that the Social-Democratic Revolution of the 20th century took place relatively fast – and in a way that was largely unexpected at the time. In some cases, wars and depressions arguably played an important role to accelerate the process – and it is possible that climate crises and other geopolitical catastrophes will play a similar role in the future. In other instances, e.g. in Nordic countries like Sweden, which used to be one of the most plutocratic countries in the early 20th century, popular mobilisations and a well-organized labour movement (rather than wars and catastrophes) played the leading role. In any case, the historical record demonstrates that institutional transformations and policy changes of great magnitude can occur in a relatively short period of time when the social pressures for change are sufficiently strong. It is also striking to see that the social-democratic agenda – including a shift of public expenditure from less than 10% of GDP to about 40-50% of GDP over the course of the 20th century, a large sustained rise of public services and a gradual decommodification of the economy – has become almost consensual after a few decades, up to a point where no significant political force is seriously proposing the economic order which prevailed until 1910. In short, we do not know when changes will occur and in which form, but we know from history that the recurrent conservative prediction of a frozen future is likely to be off-road.

4.3 Universal Justice as Class-Based Reparatory Justice

In order to be adopted and implemented, the Global Justice Platform requires a better understanding between the North and the South and a shared ability to construct mutually acceptable visions of global socioeconomic justice, i.e. shared narratives about the past and about the future. From this perspective, it is particularly important to emphasize the complementarity between the logic of universal, forward-looking justice and the logic of reparatory justice, which are both present in the Global Justice Platform. The GJP is dedicated to global socioeconomic convergence and the financing of the energy transition and sustainable development on a global scale over the 2026-2100 period. In practice, the financial needs of the GJP are met in priority by the global rich, who have benefited disproportionately from global economic growth in recent decades and face a major historical responsibility in the accumulation of GHG emissions since the industrial revolution, and particularly over the 1970-2025 period, a critical period that is responsible for more than 70% of total cumulated emissions since 1800. To put it bluntly, the billionaires and other multimillionaires of 2026 would never have been able to accumulate so much wealth without these enormous global emissions. They have been the prime beneficiaries of the global economic system leading to the current situation of rising temperature, with particularly negative environmental consequences for the inhabitants of the poorest countries on Earth (especially in Sub-Saharan Africa and South & Southeast Asia). It is therefore perfectly legitimate in our view that they become the prime contributors to the redistribution of income and wealth that is now necessary to repair the damages and to reconcile global socioeconomic convergence and the preservation of planetary habitability.
 
More generally, the development of Western industrial capitalism since the 18th century is closely linked to a system based on the international division of labour, the mobilization of natural and human resources at the world level, and the European powers’ military and colonial domination over the rest of the planet.[PIN| |See for instance Pomeranz (2000), Parthasarathi (2011) and Beckert (2014).] E.g. it is hard to see how Europe’s textile manufacturing sector could have developed with an autarkic Europe using only home-made cotton. This does not imply that cotton-producing slave plantations were a necessary condition for the industrial revolution. Economic development could probably have happened with different institutions (e.g. with paid labour rather than with slave labour to produce cotton and other raw commodities), but this implies that Western manufacturers would have paid a higher price for these commodities, and therefore that some other countries and social classes within these countries would have had more resources to follow another development trajectory. In summary, the entire history of wealth creation and accumulation since the industrial revolution is the result of a collective global process involving specific institutions and power relations, including numerous episodes of massive injustices and large-scale human and environmental damage. The distribution of income and wealth resulting from this complex and conflictual historical process should not be sacralized in any way. Instead, we should start from the common objectives – global socioeconomic convergence and planetary habitability – and adjust the institutions and policies so as to fulfill these objectives, using the best available historical evidence regarding the relation between development, equality, and sustainability.
 
In effect, the approach to universal, forward-looking justice promoted by the Global Justice Platform can also be viewed as a form of class-based reparatory justice. The forward-looking dimension is critical, especially if the objective is to convince broad majority in all countries to approve this course of action. It would make little sense to focus on reparations for previous damages (e.g. colonial and/or environmental damages) without describing precisely how the resources coming from reparations could be used to promote an inclusive development trajectory for the future. The class-based dimension is also critical. If we were to adopt a pure country-based perspective, with an exclusive focus on between-country transfers, both from an historical perspective and for the future development trajectories, without taking into account the class dimension, then it would be impossible to promote a meaningful approach to global justice. For example, consider the case of a distant descendant of a white slave owner in France or Britain who is now poor and does not own anything. Conversely, imagine the case of a descendant of a slave or a colonized worker in Nigeria or India who is now a billionaire. There is little reason in principle why the first individual should be required to pay a transfer or to work for free for the second individual. The class-based, forward-looking approach is in some ways more satisfactory, because it is both universal in its principles and reparatory in its effects, as in practice there are many more billionaires in the North than in the South, reflecting the fact that the over-exploitation of planetary resources has been both a class-based and a geography-based process from an historical standpoint. But this approach also has its own limitations. In particular, it is critical to check whether the specific universalist policy that is being advocated is sufficiently massive and progressive to compensate for observed historical damages – otherwise the rhetoric of universalism might just be a way to escape the required compensation.[PIN| |See Kanitkar et al (2019, 2024) and the Climate Equity Monitor (CEM) initiative for a discussion on how to operationalize the concept of climate equity in the context of very unequal historical responsibilities and the risks associated to exclusively forward-focused approaches.]   
 
For instance, country dividends are allocated by the Global Justice Fund on an equal per-capita basis. This is as universalist as it can get: each inhabitant of the world is receiving (via its government) the same per capita amount to finance climate investment and education and health expenditure. But because some countries are poorer than others, partly due to past injustices, the country dividends do represent a substantially larger share of GDP in the South than in the North. For example, countries in Sub-Saharan Africa receive on average 8.8% of their GDP in country dividends over the 2026-2100 period, while countries in Europe are receiving 2.5%, with a world average equal to 4.3%.[PIN| |See Bothe et al, 2026, Table 3.] The question is whether the implied implicit transfer is sufficient to compensate for past damages.
 
Similarly, global wealth tax and income taxes are paid to the Global Justice Fund on the basis of similar tax schedules for all inhabitants of the world, irrespective of where they come from, with wealth and income thresholds expressed as a function of world averages. This also follows a universalist perspective: for a given wealth or income level, each inhabitant of the world is paying the same tax. But because some countries are richer than others and have more high-wealth and high-income individuals than others, partly due to past injustices, these tax payments do represent a substantially larger share of GDP in the North than in the South. For instance, countries in in Sub-Saharan Africa are scheduled to pay on average 1.1% of their GDP in global tax revenues over the 2026-2100 period, while countries in North America/Oceania are paying 4.2%, with a world average equal to 2.8%.[PIN| |See Bothe et al, 2026, Table 9 and Appendix Tables E2c-E2d.] Again, the question is whether this is going sufficiently far.
 
In order to address this question, we use these estimates to compute the implicit between-country transfers orchestrated by the Global Justice Fund. We find that over the course of 2026-2100 period, Europe and North America/Oceania are projected to pay the equivalent of 0.8% of world GDP per year on average to the GJF, while Sub-Saharan Africa is projected to receive 0.4% of world GDP per year, South & South-East Asia 0.2% and Latin America 0.1%.[PIN| |See Bothe et al; 2026, Table 10 and Appendix Table E2e for detailed estimates by subperiod. Over the 2026-2060 period, Europe and North America/Oceania are projected to pay the equivalent of 1.4-1.5% of world GDP per year on average to the GJF, while Sub-Saharan Africa is projected to receive 0.8%, South & South-East Asia 0.5% and Latin America 0.2%.] While these are substantial transfers, they are not as large as one might have expected given the overall size of the GJF. This is because the GJF has been purposedly designed to finance climate investment and human capital expenditure in all countries (and not only in the poorest countries). In effect, lower- and middle-income groups in the North benefit from GJF country dividends. This reduces North-South transfers, but this is also what contributes to raise political support – or rather to limit hostility – in the North.
 
We should also stress that these estimates need to be interpreted very cautiously. First, these between-country transfers are computed in reference to a situation where each country would be paying the same GDP share in global wealth and income taxes and receiving the same GDP share in country dividends, and it is absolutely unclear why such a reference point has any particular interest or is especially meaningful. In our view, a more meaningful universalist norm is that used by the Global Justice Fund: country dividends are allocated on a per capita equal basis, and tax payments are paid on the basis of individual wealth and income levels, irrespective of your country. Next, this notion of “between-country transfers” is implicitly assuming that top wealth and top income individuals “belong” to a particular country – i.e. French billionaires belong to France, Nigerian billionaires belong to Nigeria, etc. This is far from clear, first because the wealth of French or Nigerian billionaires was accumulated in the context of global economic system which would not exist without the mobilization of natural and human resources at the world level, and next because the ability of French or Nigerian tax authorities to collect tax from “their” billionaires should not be exaggerated. The development of new institutions like the Global Justice Fund also changes the ability of countries to tax the various social classes of the world. In other words, any notion of “cross-country transfer” is defined relative to a particular historical and institutional context, implying that such notions should not be essentialized.

4.4 Global Justice Transfers Are Smaller Than Colonial and Climate Damages

That being said, these estimates of cross-country transfers – no matter how cautiously they should be interpreted – are useful to make comparisons with other cross-country transfers which took place in the past, and in particular to the colonial and climate damages imposed by Western countries on the Global South. We stress again that all estimates of cross-country transfers – whether they relate to the past or the future – are subject to caution and are by construction highly uncertain. One striking conclusion, however, is that the size of GJF between-country transfers appears to be relatively small as compared to existing estimates of colonial and climate damages.
 
Before we present this comparison, it is useful to describe how existing estimates of colonial and climate damages have been computed. Generally speaking, there exists a large and growing literature attempting to estimate colonial and climate damages, in relation to the vivid global discussions on colonial and climate reparations.            
 
Regarding colonial damages, and in particular the damages imposed by the transatlantic slave trade system, the most sophisticated available estimates are those that were recently proposed in the “Report on Reparations for Transatlantic Chattel Slavery in the Americas and the Caribbeans” published by the American Society for International Law (ASIL) and the Center for Reparations Research (CRR, University of West Indies) (see Bazelon et al, 2023, and Robinson, 2023). These ASIL-CRR computations are also important because they have been adopted as reference estimates by a number of governments and international organizations, including the Reparations Commission of the Caribbean Community (CARICOM) and the African Union. These estimates also play a major role and are frequently referred to in several declarations on enslavement and reparations which were adopted by the UN General Assembly in recent years and months.[PIN| |See the “Declaration of the Trafficking of Enslaved Africans and Racialized Chattel Enslavement of Africans as the Gravest Crime against Humanity” adopted in March 2026.] In addition, one key strength the ASIL-CRR estimates is that they are very transparent and clearly explained. To summarize, the authors start from an estimate of the unpaid wages which the approximately 20 million enslaved victims of transatlantic slavery should have received over the 1450-1888 period (most of them over the 1780-1860 period, which corresponds to the peak of the transatlantic slave trade system and the outbreak of the industrial revolution). They then add an estimate of the damages corresponding to various punishments and mistreatments imposed on slaves (presumably to raise productivity), which they estimate to be roughly of the same order of magnitude as unpaid wages. According to the ASIL-CRR estimates, the total damages imposed on slaves by the transatlantic slave system amount to approximately 100-120% of world GDP in 2020. While this may seem very large, the authors of the report rightly stress that these are damages accumulated over very long time periods, so they should rather be compared to total cumulated world GDP over similarly long period. For instance, they emphasize that these total damages represent only 2-3% of cumulated world GDP over the 1800-2020 period (and up to 13% in the case of Britain).[PIN| |According to the ASIL-CRR estimates, total damages amount around 100-120% of world GDP (about 100-120 trillion dollars in 2020), including as much as 600% of British GDP for the damages imposed by Britain, 300% of French GDP for the damages imposed by France, and 150% of US GDP for the damages imposed by the US. While this seems very large, the authors stress that this makes only 13% of cumulated British GDP since 1800 in the case of Britain and only 4% of cumulated US GDP for the case of the US.  See Bazelon et al (2023) and Robinson (2023).] In other words, the point is not to say the entirety of wealth creation since 1800 was due to slavery or colonialism, but rather that a significant fraction can be attributed to these processes.  
 
It is also important to take into account other colonial damages, including fiscal transfers and war tributes imposed by Britain to India, by the Netherlands to Indonesia, by France on Haïti, and so on. Recent research by Nievas and Piketty (2025) on historical balance of payments at the world level since 1800 shows that the corresponding damages are equivalent to about 70% of world GDP in 2025.[PIN| |Net colonial transfers are estimated to represent about 0.5% of world GDP on average over the 1800-1900 period and 0.4% over the 1900-1960 period, i.e. around 70% of world GDP in total. See Nievas and Piketty (2025, Figure 25). Nievas and Piketty also provide estimates of the transfers due to unequal exchange (e.g. low commodity prices, partly due to forced labour), which appear to be comparable to ASIL-CRR estimates (approximated 1.5% of world GDP per year over the 1800-1870 period, i.e. about 110% of world GDP in total). Note that the Nievas-Piketty estimates cover a shorter period than the ASIL-CRR estimates and do not explicitly include a valuation for mistreatments. On the other hand, they take a broader view of unequal exchange and forced labour. In practice, the various differences in scope and methods tend to compensate each other, so that aggregate estimates are relatively close.] It should be pointed out that all of these estimates (both the slavery damages and other colonial damages) are computed using a conservative lower bound value for the capitalization factor (namely the world economy’s nominal growth rate),  and that they would be a lot larger if we were using higher – and arguably more meaningful – rates of return.[PIN| |Because we capitalize all past amounts using the world economy nominal growth rate, a damage equal to 1% of world GDP in 1800 is worth 1% of world GDP in 2025. In practice the returns to capital are significantly larger than the nominal growth rate (i.e. R>G, both at the world level and at the country and regional levels; see e.g. Bauluz et al, 2025, Figures 29-30), meaning that the damaged countries could have obtained much larger amounts by investing these amounts (including in education, public infrastructures, etc.). See Nievas and Piketty (2025) for an analysis of counterfactual development scenario along these lines. The ASIL-CRR estimates also a capitalization factor which in practice is close to the nominal growth rate. Note that using a return that is just a little bit above the nominal growth rate (say by 1% per year) can raise enormously all amounts when it is capitalized over long periods (e.g. 1.01200=7.3). Conversely, in case one uses a capitalization factor that is smaller than the nominal growth rate, for instance if one uses the nominal price index (as is frequently done), then by construction all amounts coming from the past will look artificially small. In our view, using the nominal growth rate provides a simple, meaningful lower-bound capitalization factor which can help clarify the discussion and the orders of magnitudes which are at stake in these debates.]
 
Finally, we add indicative estimates of cumulated climate damages over the 1800-2025 period (around 60% of world GDP in 2025) and compute total estimates of colonial and climate damages (about 240% of world GDP), which we report on Figure 4.1.[PIN| |See Bothe et al, 2026, Section 8.2 and Appendix Figures T1a-T1f, T2a-T2f and T3a-T3f.]

When we translate these damages into annual reparations over the 2026-2100 period, we find that the amounts are significantly larger than the North-South transfers orchestrated by the Global Justice Fund. That is, GJF implicit North-South transfers represent the equivalent of about 0.8% of world GDP per year over the 2026-2100 period, as compared to 3.2% of world GDP per year during the same period in order to compensate for colonial and climate damages (Figure 4.2).

Note that climate damages in our benchmark computations (about 60% of world GDP by 2025) look relatively moderate as compared to colonial damages (180% of world GDP, including 110% for slavery and 70% for other colonial damages). This is entirely due, however, to the fact that we look only at climate damages imposed up to 2025, and that most of the temperature rise and associated damages are yet to come. For instance, the potential climate damages imposed during the 2026-2100 by non-cooperative countries are projected to be a lot larger (100-200% of world GDP or more, depending on the size of the country), as we see below. While our estimates of climate damages are based on simplistic first-pass calculations intended to provide an order-of-magnitude approximation, alternative estimates proposed by other researchers – including Callahan and Mankin (2022) and Fanning and Heckel (2023) – are broadly consistent with ours, despite several methodological differences.[PIN| |See Bothe et al, 2026, Section 8.2.] Generally speaking, we should stress that there is no perfect way – and there will be never a perfect way – to translate the principle of climate equity and historical responsibilities into quantified policies. All existing estimates rely on plausible thought experiments and counterfactual scenarios to approach this fundamental question.[PIN| |For instance, our estimates rely on the choice of a k factor measuring how much rich countries should have reduced their cumulated emissions in the past (e.g. by using less fossil fuels and developing alternative energy sources and production, transportation and heating systems). The estimates by Callahan and Mankin (2022) rely on the “one country out” counterfactual experiment (i.e. they estimate the climate and GDP impact of taking out one by one each country’s historical emissions). All these methods make sense and we find It difficult to rank them in any meaningful way.] Ultimately it is up to democratic deliberation to weight these different pieces of evidence and use the natural language – together with mathematical and statistical language – in order to communicate meaningful arguments to others and reach a collective decision.

4.5 Scaling Up the Global Justice Platform to Meet Historical Responsibilities

To summarize, the implicit North-South country transfers orchestrated by the Global Justice Platform – in particular via the Global Justice Fund – appear to be significantly smaller than what would be required to address the historical responsibilities implied by colonial and climate damages. This is consistent with our findings regarding the long march toward equal access to education and health. That is, in order to provide full equal access in the immediate future – rather than by 2100 – the Global Justice Fund would need to be approximately four times larger, i.e. around 40% of world GDP in annual expenses rather than 10% (see the discussion in Chapter 2). Note also that it is not entirely a coincidence that the logic of reparatory justice and the logic of forward-looking, universal justice both lead to the conclusion that the Global Justice Platform should be scaled up. The point is that colonial and climate damages explain a significant part of the inequality of opportunities that we see today between countries. If it was explaining the entirety of this inequality, then both approaches would lead to approximately the same magnitude of just redistribution. In practice, estimated historical damages appear to be explaining less than the entirety of the gap, which is why universal justice tends to lead to even larger redistribution than reparatory justice.
 
There are different ways to scale up the Global Justice Platform in order to meet the principles of historical responsibilities and reparatory justice – and also to better address the principles of universal justice. The simplest change is to raise the overall size of the Global Justice Fund, for example by applying larger and more progressive tax rates for the global wealth and income taxes, leading to higher per capita country dividends. In effect, this would also increase the level of North-South transfers. This could raise issues in terms of political acceptability. But in case it is possible to convince citizens in the North and in the South that this is the way to go, then this is perfectly doable. According to recent research, popular support for global redistribution appears to be greater than commonly thought.[PIN| |See Fabre, 2025 and Fabre et al, 2025. See also Cappelen, Støstad and Tungodden, 2025. Note that these studies do not include an explicit long-term target for global convergence and planetary habitability as potential outcomes of international redistribution, which could potentially raise support for redistribution to even larger levels. On the other hand, they do not attempt to measure the negative impact of real-life anti-redistribution discourses (which can sometimes be quite persuasive, especially if they are well financed; see Cagé, 2020, 2024).]
 
The second possible change is to have larger per capita country dividends for some countries (say, for India or Nigeria rather than for France or Britain), on the basis of the fact that this is the only way to implement full compensation for past colonial and climate damages and higher present exposure to climate change. This would naturally be the most direct way to raise North-South transfers. One could also imagine country-specific global wealth and income tax schedules. For instance, billionaires from India or Nigeria would still pay the global wealth tax, but billionaires from France or Britain or the US would pay an even larger wealth tax, for a given wealth level, on the basis that they are responsible for a larger part of historical colonial and climate damages. This would certainly make the Global Justice Fund more complex in its functioning and presentation than the “universal” per capita dividends and tax schedules that we envision in our benchmark scenario. But if this is the only way to have full compensation for historical damages, and if it is possible to build political support for such a platform, then this is the path which should be followed.
 
Finally, it is very important in our view to consider the possibility of supplementing the Global Justice Platform with country-specific transfers and reparations. One particularly extreme and well-known case is that of Haïti, which was forced by France to pay a colonial tribute equal to about 300% of Haïti’s GDP in 1825, in order to compensate French slave-owners for the loss of what used to be their property. A number of scholars have stressed that it is not too late for France to pay back the equivalent of 300% of today’s Haïtian GDP (i.e. less than 2% of French GDP).[PIN| |See e.g. Piketty (2020, 2022).] In the context of the Global Justice Platform, these payments could be located in the Global Justice Fund in order to finance specific investment in infrastructures and education and health expenditure which could accelerate convergence in the case of Haïti. Note that this approach to reparations – via collective regional funds which could be used for public investment – is the same as that defended by the Caribbean Community Reparations Commission in the context of post-slavery reparations in general (see also Bazelon et al (2023) and Robinson (2023)). Similarly, one could imagine direct transfers from Britain to India in order to compensate for direct fiscal extraction (Home Charges and similar flows) that were made during the colonial period, and equivalent transfers from the Netherlands to Indonesia.[PIN| |See Nogues-Marco (2021), Patnaik and Patnaik (2021) and Nievas and Piketty (2025).] Forced labour was also used in some colonial empires as part of their fiscal resources up until World War II, in particular in West Africa under French rule.[PIN| |See van Waijenburg (2018).] It seems difficult to refuse all direct reparations in relation to these very well documented damages, especially given that other damages which happened during WW2 (or sometimes during WW1) are still being compensated today. Finally, the countries which benefited hugely from GHG emissions – e.g. Norway or other oil producers – could face a specific taxation on the basis of their accumulated sovereign fund (and not just by taxing the private wealth of their billionaires). We should make clear that we are not in a position to give a complete list of these country-specific transfers and reparations, and that this is supposed to supplement – not to replace – the more universal mechanisms orchestrated by the Global Justice Fund.
 
Generally speaking, we stress that these discussions about past damages and reparations are likely to be difficult and to meet strong opposition in the North, where alternative narratives tend to stress the supposedly positive historical externalities brought by Western institutions and inventions to the rest of world.[PIN| |One difficulty is that these supposedly positive externalities are very difficult to demonstrate and quantify, in contrast to the damages caused by slavery (unpaid wages, harsh working conditions) and colonial transfers, which are very well documented. Note also that countries from the South are arguably facing other negative externalities from the North, in particular the fact that it is difficult to develop when a country’s highest skill groups have a strong incentive to migrate to rich countries (an issue which rich countries were not exposed to with the same magnitude during their own development trajectory).] At the end of the day, the best strategy to undo nationalist biases might be to demonstrate through the construction of new international institutions and country-level policies that a platform like the GJP can bring concrete development successes, after which it could be easier to scale up the policies and reach a better mutual understanding and recognition of past experiences. One reason for optimism is the strong support for international solidarity and redistribution documented in recent research, and also the fact that younger generations tend to be more exposed to shared global narratives.        
   

4.6 A Coalition for Justice: With or Without the US and/or China

We now move to another crucial question, namely the extent to which it is possible to implement the Global Justice Platform with an incomplete coalition of countries, and in particular without some of the largest countries (typically the US and/or China). Our general conclusion is the following. While it is obviously preferable to put in place the Global Justice Platform with all countries, it is also possible if needed to implement the most important features of the GJP with an incomplete coalition of countries (including without the US and/or China), assuming that the remaining coalition is sufficiently large and cohesive and is prepared to impose adequate sanctions to non-participants, in proportion to the damages they impose on participating countries.
 
Assume, for instance, that the US does not participate in the GJP and that all other countries do participate. Further assume that the US follows the “Slow Decarbonization” trajectory, while other countries follow the “Fast Decarbonization” trajectory.[PIN| |More precisely, we assume that the US follows the PI-SC trajectory (i.e. Persistent Inequality/ Slow Decarbonization, with no reduction in work hours, no shift to immaterial sectors or in food habits, etc.), while other countries follow the SC-FC trajectory (Sustainable Convergence/Fast Decarbonization). See Bothe et al (2026) and Chancel et al (2026) for full details.] According to our projections, the extra GHG emissions coming from the US over the 2026-2100 period would lead to rise in temperature from 1.8°C to 2.0°C (Figure 4.3). In order words, other countries would still be able to limit global warming to close to 2°C. On the other hand, the projected damages imposed on other countries could be substantial: about 3.0% of world GDP per year on average over the 2026-2100 period (i.e. a cumulated damage larger than 200% of world GDP between 2026 and 2100).[PIN| |Using our benchmark parameters on the impact of temperature rise on GDP and well-being losses.] One possible retaliation strategy for GJP countries would be to impose a corrective tax of about 80% on all US exports throughout the 2026-2100 period, so as to collect a projected tax revenue that is approximately equivalent to the damage.

Now assume that China does not participate to the GJP and that all other countries do participate. According to our projections, the extra GHG emissions coming from China would lead to rise of temperature from 1.8°C to 2.3°C (Figure 4.4). The impact would be larger than with the US dropping out, due to the larger size of the Chinese economy over the 2026-2100 period.  The projected damages would be enormous (about 8.3% of world GDP per year on average over the 2026-2100, i.e. a cumulated damage larger than 500% of world GDP between 2026 and 2100) and the corrective tax on Chinese exports would need to be as large as 180% or more.[PIN| |These sanctions are substantially larger than those computed in some of the literature on climate clubs (see e.g. Nordhaus, 2015), first because we use more recent (and arguably more plausible) estimates of climate damages, and next and because damages are estimated in the context of a model trying to reconcile global socioeconomic convergence with the preservation of planetary habitability.]

We should make clear that the objective is to keep these countries in the Global Justice Platform and that in our view such corrective taxes are likely to make them stay in GJP. It is very difficult, however, to make precise computations about this. A complete analysis of optimal sanctions and their likely impact would need to take into account all multisectoral global linkages, and also the role of financial sanctions, which would look very different following our proposed reform of the international financial system (even if this reform is adopted with an incomplete coalition of countries). Given the fact that each individual country – including the US and China – is scheduled to reduce its influence over the course of the 21st century, leading a relatively multipolar structure (see Figures 3.8a-3.8d), our intuition is that it will be very difficult for any single country to resist adequate pressure and sanctions in case other countries in the rest of the world (or at least the vast majority of other countries) are sufficiently determined to join the Global Justice Platform (or a similar platform) and to make it work. But a full-fledged analysis of the relevant structure of coalitions and sanctions which could make this process successful remains to be produced, and falls outside the scope of the present report. 

4.7 Very Gradualist vs Gradualist vs Radical Strategies

In our view, the set of institutional transformations and policy changes included in the Global Justice Platform corresponds to a relatively moderate and gradualist strategy. Probably the best illustration is the fact that the very large existing inequality of access to education and health between poor and rich countries is reduced only very gradually in our benchmark scenario. In effect, it will take the whole 21st century to reach equality of opportunities in access to education and health for all inhabitants of the planet, whether they are born in poor or rich countries (Figures 2.5a-2.6b). A more ambitious scenario would involve faster implementation of the principle of equal access to education and health. This would require an annual budget that is up to four times larger than the one proposed in our benchmark scenario (about 40% of world GDP rather than 10%) (Figure 4.5). Another complementary illustration of the moderate and gradualist nature of GJP proposals is the fact that the induced transfers are relatively small as compared to historical colonial and climate damages.

Some readers will find the Global Justice Platform to be too gradualist or moderate. As we noted, we strongly support all strategies to scale up the size and scope of the Global Justice Fund and to complement the platform with other policies, including country-specific transfers and reparations. The same remark applies to our proposed transformation of the global socioeconomic system and the property regime, including the new balance between public and private wealth and the extension of economic democracy and workers’ voting rights in corporations and other organizations. In our view, it has the potential in the long-run to fundamentally reshape the structure of power relations and to lead to a gradual decommodification of the economic system. Critics will find these proposals too gradualist, especially regarding the speed at which property relations and profit-making motives are being redefined and the economy as a whole is being decommodified. We share these criticisms and welcome all alternative proposals and political strategies which could accelerate the process.
 
Conversely, others might consider that the Global Justice Platform is already too radical. In our benchmark scenario, the revenues and expenses of the Global Justice Fund represent about 10% of world GDP per year over the 2026-2060 period. This represents a lot more resources than the total combined resources which are currently allocated to development aid or international organizations (less than 0.4% of world GDP). This also represents a lot less than what would be needed in order to implement immediate equal opportunities (about 40% of the world GDP). We should again emphasize that we do not have satisfactory answers to all questions and that many choices are open for discussion and deliberation. We also stress that very gradualist strategies – for instance the 2% minimal wealth tax advocated during the G20 Brazilian presidency in 2024 – can in some cases be very useful.[PIN| |See Zucman (2024). Expected revenues are 200-250 billion $ per year (about 0.2% of world GDP).] Historically, top income tax rates were very small when income taxes were created around or before World War 1, often around 2-5% at the time of initial parliamentary adoption, and in the space of a few years they jumped to 80-90%.[PIN| |See e.g. Piketty (2022, Figures 20-21).] We consider all these different approaches complementary to each other, and we are not in a position to decide in advance which one is most likely to be successful. What is critical in our view is to be very clear about what can be achieved regarding global socioeconomic convergence and planetary habitability with the various platforms and policies under consideration. We very much hope that the material presented in this report can help to clarify these issues.

Chapter 3. The Global Justice Platform: Toward A New Democratic International Order

Before we move on to the discussion of political strategies, it is critical to situate the Global Justice Platform within a broader international and institutional context. Generally speaking, to achieve its objectives, the Global Justice Platform requires not only the creation of the Global Justice Fund, but also a broader transformation and democratization of the international economic and monetary system, including the governance and voting rules of international institutions. We start with the governance of the Global Justice Fund (Chap. 3.1). We proceed with the International Clearing Union aimed at ending global imbalances with regard to current account surpluses and deficits (Chap. 3.2) and the transformation of the International Monetary Fund into a United Nations Central Bank issuing a new international currency (Chap. 3.3). The democratic voting rules that we envision for the Global Justice Fund, the United Nations Central Bank, and other international institutions stand in sharp contrast to the plutocratic rules associated with the current system. The point, however, is that the current international order faces a serious legitimacy problem and is inherently fragile and unstable. The emergence of a multipolar world and the current system’s inability to confront the existential challenge of development and planetary habitability make the rethinking of global governance both necessary and urgent (Chap. 3.4-3.5).[PIN| |This Chapter aims to synthetize some of the material that is presented in a more detailed manner in Bothe et al (2026). We refer all interested readers to this work and to the online replication package. For an historical analysis of the evolution of international institutions, their plutocratic design and the appropriation of funds by rich countries, see Druschke and Nievas (2026). By comparing governance rules and voting rights used by the various organizations, this work demonstrates the crucial role of these rules for the decisions that are being made, including the structure of revenues and expenses.]

3.1 The Global Justice Platform and the Reset of Bretton Woods Institutions

The centerpiece of the Global Justice Platform is the creation of the Global Justice Fund. Given its crucial role and the magnitude of its resources (Figure 2.2), it is, in our view, preferable to conceive the GJF as a new international institution rather than as an outgrowth of existing ones (e.g., the World Bank or the UN Development Program).
 
It is also critical that the Global Justice Fund be governed according to very strict principles of democracy and transparency. In particular, the GJF should enforce strict rules on how its resources are collected and allocated, including rigorous monitoring of the distribution of asset ownership and income flows within each country and at the global level. Country dividends should be conditional on the strict realization of specific climate targets (investment in low-carbon energy infrastructure, verifiable GHG emission reductions, and the end of deforestation), human capital targets (education and health expenditure) and inequality targets (distribution of income and wealth). Monitoring of income and wealth inequality is particularly critical in order to avoid any misuse of the funds (see Chapter 2). Only very strict and transparent rules and monitoring can help build and maintain a high level of trust in the Global Justice Fund.
 
Regarding the decision-making system, we recommend that the Global Justice Fund should be governed according to a double majority system, whereby all regular budgetary decisions need to be approved by 55% of countries representing 60% of the world population. This is close in spirit to the concept of qualified majority currently applied in the European Union[PIN| |Namely, the Council of the European Union (where national ministers from each EU country meet to negotiate and adopt EU laws) uses a qualified majority of 55% of EU member states representing at least 65% of EU population. In order to be adopted, EU legislations need to be approved both by the Council (using this double majority rule in areas covered by qualified majority or the unanimity rule in other areas) and by the European Parliament. ] with one critical difference: budgetary and fiscal decisions would follow the regular double majority system for the Global Justice Fund, whereas they require unanimous agreement in the EU (arguably a recipe for inertia on these issues).[PIN| |Historically, the EU was developed with a focus on free trade and free capital flows, and limited emphasis on common budget and taxation. This is arguably one of the key challenges which the EU faces today in order to redefine its role in relation to the new world order and climate challenges. This of course does not imply that a double majority could decide to do anything. The GJF Charter should specify in advance the guiding principles and constitutional rules under which the Global Justice Fund operates, including the type of global wealth tax and global income tax, the purpose of the country dividends, the functioning of the World Sovereign Fund, and so on. It would be impossible and counterproductive, however, to set all the details and parameters decades in advance. It is therefore critical to have clear and functional decision rules to adopt annual budgetary and fiscal decisions and monitor the entire system.  
 
The double majority system is arguably more satisfactory than a simple majority based either on the number of countries or on population alone. The pure country-based system is based on the “one country, one vote” principle and has been used to adopt resolutions in the UN General Assembly since 1945. All countries have the same weight, irrespective of their population. This can work for some purposes, but in practice this comes with the fact that no significant budgetary power is allocated to the UN General Assembly, and that the international institutions with more substantial economic and financial power (starting with the International Monetary Fund and the World Bank) are governed for the most part through GDP-based voting rules (more on this below). The pure population-based system follows the principle “one person, one vote” at the world level. The problem is that it gives very little weight to the smallest countries. It has virtually never been used in any international organization. 
 
It is worth stressing that the double majority system which we advocate for here is relatively conservative, in the sense that it relies entirely on existing national government and country-level political institutions. That is, each country is represented by its head of state (or by ambassadors or delegates nominated by the head of state or the national government, depending on the country constitution), in the same manner as in the United Nations or other existing international institutions. A more ambitious system would involve direct elections at the world level in order to choose representatives from each country and region, which would then take decisions at the level of the Global Justice Fund.[PIN| |See the “Manifesto for the democratization of Europe” (tdem.eu) for an attempt to combine national and transnational parliamentary decision rules in order to extend federal budgetary power in Europe.] It is important in our view to be relatively flexible about such possibilities and to design the GJF Charter in such a way that it is possible in the future to implement such changes of governance rules in the direction of direct democracy.[PIN| |I.e. one could think of larger qualified majorities to revise the GJF Charter itself (e.g. 60% of countries representing 70% of the population) but one should avoid unanimity or quasi-unanimity requirements.] We should also point out that the fact that the GJF controls significant resources can potentially make it easier to set conditionalities to national governments, especially in terms of social, environmental and economic justice, as well as regarding the protection of human rights in general.   

3.2 An International Clearing Union for Equitable & Sustainable Trade

The Global Justice Fund is the centerpiece of the Global Justice Platform, but it is not self-sufficient. It needs to be supplemented by other major reforms of the international financial system. In particular, even with output and income convergence, we can still have major imbalances, in the sense that some countries accumulate large current account surpluses and foreign assets, while others accumulate large current account deficits and foreign liabilities. Historical and contemporary evidence shows that such global imbalances can create major economic, financial, commercial, and geopolitical tensions, which can ultimately threaten the process of sustainable convergence.
 
According to the Global Justice Platform, the adequate institutional tool to end global imbalances is the creation of an “International Clearing Union” (ICU). This is close in spirit to the proposal made by Keynes in 1943, but adapted to the needs of the 21st century. Ideally, the ICU should be hosted by a newly created United Nations Central Bank (UNCB), which would replace the IMF and issue a new international currency (more on this below). The ICU could also be hosted by the IMF, similarly to what was envisioned by Keynes. The chief objective of the ICU is to end global imbalances, i.e. to have all current account balances and foreign asset positions converge to zero over the course of the 21st century. Observed trajectories over 1970-2025 and projected trajectories for 2025-2100 are described in Figures 3.1a-3.1b.

It should be noted that the current situation is characterized by very large global imbalances. In particular, the US has accumulated large trade and current account deficits over the 1990-2025 period, resulting in an enormous negative foreign asset position (close to 20% of world GDP in 2025). The corresponding positive foreign asset positions are mostly located in East Asia, Europe and the Middle East. In our benchmark scenario, we assume that all current account positions converge to levels close to zero by 2035. Subsequently, current account positions over the 2035-2100 period are projected to be close to zero, so that net foreign asset positions gradually move toward zero. One could also adopt even more gradual trajectories (say, with current account positions close to balance by 2040 or 2050). In any case, the US will need to move from large trade deficits today to significant trade surpluses in the medium term (around 2030-2050), before converging to trade balance in the longer run (say, after 2060-2070).[PIN| |See Bothe et al, 2026, Appendix Figure B1w.] This shift in the US trade balance is a consequence of the unwinding of the US large negative net foreign asset position, and the size of the required shift is further amplified by the Global Justice Platform.[PIN| |In particular the end of exorbitant privilege (which will amplify the net interest outflows to the rest of the world) and the large GJF wealth and income tax payments borne by US millionaires and billionaires both contribute to magnify the size of the shift (which would already be substantial in any case).] If well managed, this rebalancing of trade patterns can be in the common interest of all countries. It can also be a source of conflict, both in the US (where different views on how to generate such a trade surplus are likely to coexist)[PIN| |Many US actors would welcome large trade surpluses in case this could come entirely through a rise in domestic production (e.g. via a rebuilding of domestic industrial strength and/or increased dominance in high-tech sectors) and with no consumption cut. Given the magnitude the current trade deficit and net foreign debt, it seems unlikely however that the required adjustment can be implemented without a significant consumption cut, or at least a large consumption shift from material to immaterial sectors, given the fact that the country also needs to reduce its enormous GHG emissions and material footprint.] and in the rest of the world (where some concerns might be raised regarding the absorption of US exports).[PIN| |This concern, while understandable, is likely overstated: the implied increase in US exports is modest relative to the projected growth of GDP in Sub-Saharan Africa and South and Southeast Asia over the same period. The absorption of these exports does not pose a structural constraint on the convergence trajectory, and can on the contrary contribute to accelerate the convergence process, as poor countries are able to import large flows of high-tech equipment and services (financed by the Global Justice Fund).]
 
The basic mechanism behind the ICU is the same as that described by Keynes (1943) and more recently by Greenwald and Stiglitz (2010). Namely, the current account surpluses and deficits accumulate as credits and debits in countries accounts in the ICU (at the UNCB or at the IMF). To prevent persistent imbalances, symmetric and progressive penalties apply once balances exceed a defined threshold. This incentivizes surplus countries to spend or revalue and encourages deficit countries to adjust gradually their consumption level (and devalue their currency if needed), thereby supporting global demand and full employment and preventing major global imbalances to build up. Several specific proposals have been made regarding the penalty formula, and we do not take a firm stance on this issue. We stress that such penalties are necessary in order to ensure the stability of the system but should not prevent countries from having significant temporary current account surpluses and deficits when they are subject to specific shocks, as long as these imbalances do not build up and persist at large levels over time.[PIN| |See Bothe et al, 2026, Section 3.4, for a more detailed discussion and for a description of the formulas advocated by Keynes (1943) and Greenwald and Stiglitz (2010).] The revenues coming from this penalty system should be allocated to the Global Justice Fund, so that the penalties (if applied) can contribute to finance global sustainable convergence.[PIN| |In our benchmark projections, we assume that the penalties are sufficiently large that they do not need to be applied in equilibrium, so that we do not need to add the corresponding revenues to GJF budget.]
 
One criticism which has often been made to the symmetric penalty system on current account surpluses and deficits is that some developing countries might need to run persistent current account deficits to bring in international investment flows during the take-off stage.[PIN| |See Kalecki and Schumacher (1943) and Davidson (2002, 2004). See Morgan and Patomäki (2026) for a review of discussions around ICU proposals since the 1940s. See also Ocampo (2010) and Kari and Holappa (2026) for proposals to exempt low-income countries from ICU-type penalty systems.] However, in practice, large current account deficits have often been used by rich countries (typically the US) rather than by poor ones. Most importantly, this criticism does not apply to the present ICU proposal, because it is embedded in the Global Justice Platform and a broader plan to finance global sustainable convergence. Thanks to the Global Justice Fund and the World Sovereign Fund, developing regions will receive country dividends and investment flows, allowing them to invest and develop without accumulating large current account deficits (which markets would not have allowed them to do in the first place anyway).
 
Note that several mechanisms can contribute to restore current account balances, including currency devaluation and reevaluation, temporary capital controls, and sector-specific tariffs and subsidies. The exchange rate mechanism and the international monetary system are particularly important here. One standard explanation for the large US current account deficits is the lack of an international reserve currency. In effect, many countries use the US dollar as an international reserve currency and dollar denominated assets as reserve assets, which leads to excessively large purchases of US assets (including public debt, equity shares, and other assets) and contributes to global imbalances (especially in light of the shrinking size of the US economy relative to world GDP). This is why we believe that the creation of the ICU should come together with a broader transformation of the current international monetary system and the creation of a new international reserve currency.
 
Finally, a key objective in our view of the ICU is to equalize the rates of return on foreign assets and liabilities for all countries and to put an end to the so-called “exorbitant privilege” of the US and other rich countries. The fact that rich countries are able to obtain substantially higher returns on their foreign assets than what they pay on their foreign liabilities – partly because their currencies serve as reserve currencies and partly because they control the world’s largest financial institutions, both public and private – is well-known to lead to massive transfers from poor to rich countries.[PIN| |Recent research has shown that the “exorbitant privilege” has grown in magnitude in recent decades. This appears to reflect various factors, including the impact of new regulations put in place in the aftermath of the 2008 financial crisis (which in effect require large financial institutions to hold more safe reserve assets issued by rich countries) and structural biases against poor countries by credit rating agencies and governance indicators set up by international institutions. See Nievas and Sodano (2024).]
 
The magnitude of the implied transfers is striking. Over the 2000-2025 period, the US and Europe have received on average the equivalent of 0.6-0.8% of world GDP every year from other world regions (including the poorest world regions) due to this differential in rates of return. This is more than twice as large as the total world flows of development aid and assistance. According to our benchmark scenario, the rates of return on foreign assets and liabilities are scheduled to converge to the same level for all countries over the 2026-2030 transition period, so that in effect the exorbitant privilege will be reduced to zero by 2030 (Figures 3.2a-3.2b). We could also think of more gradual processes, but given the magnitude of the transfer it is preferable in our view to end it as soon as possible. One of the key advantages of the ICU system is that this can directly be implemented within the system of countries accounts and credits/debits kept at the level of the UNCB or the IMF.

3.3 An International Currency for the Planet: from IMF to UN Central Bank

In our ideal scenario, we propose to create a new institution, the United Nations Central Bank (UNCB). The UNCB would replace the IMF, issue a new international reserve currency (the United Nations Currency or UNC), and operate the International Clearing Union (ICU) (Figure 3.3). Although we find it preferable to create a new institution, with the same democratic voting rules as the Global Justice Fund, we stress that this transformation of the international monetary system could also emerge as a gradual evolution from the current system. That is, the “Special Drawing Rights” (SDR) that are currently issued and administered by the IMF could gradually evolve into a new international currency similar to the UNC which we discuss here.

In particular, it is worth stressing that the SDR system has already started to evolve significantly in recent decades (particularly with the large SDR creations following the 2008 financial crisis and the 2020 Covid crisis, see Figure 3.4) and is likely to continue its transformation in the future. The most important change from our viewpoint is to transform SDR from their current status as a central bank currency into a genuine international currency. In particular, the key characteristic of the UNC (or the new SDR) is that it could be used as the unit of account for international trade and financial transactions and serve as the reference world currency. The Global Justice Fund and the World Sovereign Fund would naturally use the UNC as unit of account, and the WSF would issue UNC-denominated public debt.[PIN| |About 30% of world GDP over the 2026-2050 period. See Bothe et al, 2026, Figure 13. The aim is that UNC-denominated debt becomes the largest and most reliable safe asset in the world.] We propose to start with the current SDR exchange rates (i.e. 1 UNC = 1.18 Euro, 1.36 Dollar, 9.39 Yuan, etc.)[PIN| |These are the SDR exchange rates published by the IMF as of March 27 2026. The SDR value is based on a basket of five currencies – USD, EUR, JPY, GBP, and CNY (added in 2016) – and is recomputed by IMF on a daily basis.] and to shift to a system of fixed adjustable exchange rates between the UNC and the national currencies. The general principle is that all currencies should gradually move to their purchasing power parity over the 2026-2100 period (Figure 3.5).

The two key advantages of this new monetary system are, first, that it would bring a lot more stability to exchange rates (especially compared to the erratic fluctuations observed in recent decades), and, next, that it would put an end to the structural overvaluation of the currencies of rich countries (especially the Dollar) and the structural undervaluation of currencies of poor countries. This situation is largely due to the fact that there exists no international reserve currency (so that the Dollar ends up playing a role that is simply too big for the size of the US economy). In principle, it could be in the interest of all countries to move to this new system, including the US, who experience many adverse consequences of the Dollar overvaluation (especially in terms of trade deficit). In practice, many problems need to be addressed. One central issue is the speed of convergence to purchasing power parities. Unlike the end of exorbitant privilege (which can be implemented almost immediately, say by 2030), it would probably not be wise to proceed similarly for exchange rates, as this could entail some negative trade consequences in a number of developing countries. The target should be purchasing power parity, as determined by the results of ICP (International Comparison Program) price surveys organized by international organizations (the latest one in 2021). In the future, ICP surveys should be organized on an annual basis. But this PPP target has to be examined very closely, on a sectoral basis, in particular by distinguished tradable and non-tradable goods and services, and on the basis of the target current account and trade balance of each country.[PIN| |The occurrence of exchange rate adjustments and the speed of purchasing power parity convergence are complex issues which should be carefully examined by the governing bodies of the UNCB and the ICU. In particular, all exchange rate adjustments should be deliberated and decided under the approval of UNCB board, so as to avoid non-cooperative competitive devaluation.] Properly implemented, this reform of the international monetary system has the potential to improve considerably the terms of trade for poor countries and to end the situation of unequal exchange in which they have been confined ever since the colonial era.[PIN| |See Nievas and Piketty (2025) and Keller (2026).]
 
Regarding the direct creation and allocation of international currency by the UNCB, our approach is relatively cautious and conservative. Generally speaking, the objective of the Global Justice Platform is to finance sustainable development predominantly via the progressive taxation of wealth and income, and not through money creation. The total revenues and expenses of the Global Justice Fund are projected to represent about 8-10% of world GDP per year over the 2026-2060 period, while the World Sovereign Fund (WSF) is set to stabilize its assets around 60% of the world GDP (i.e. about 10% of the world capital stock). These substantial amounts are scheduled to be financed for the most part by the tax revenues coming from the global wealth tax and the global income tax, and this should always remain the backbone of the Global Justice Platform.
 
That being said, if used carefully, UNCB money creation can serve two main purposes: reserve requirements (financial stability) and sustainable development. First, UNCB money creation and allocation to countries can be useful for reserve purposes and current account management. One standard rationale in the literature on international clearing unions is that country central banks should have enough reserves to be able to confront short-term trade shocks. Following this logic, the UNCB would need to issue and allocate to countries the equivalent of around 0.5% of world GDP each year.[PIN| |With a nominal world growth rate is about 5% (3% real growth and 2% inflation), it takes annual money creation around 0.5% of world GDP to reach and maintain central bank reserves around 10% of world GDP (close to average reference level). This is close in spirit to the proposal made by Greenwald and Stiglitz (2010) to have annual SDR issues around 200-300 billion $ (about 0.2-0.3% of world GDP at the time), except that they are aiming for somewhat lower reserves.]
 
Next, the UNCB should also issue the equivalent of another 0.5% of world GDP each year to finance sustainable development, e.g. by buying bonds issued by countries or regional development banks to finance climate action. This is very close in spirit to the proposal by the “Bridgetown Initiative”, and which calls upon the IMF to boost country capacity to invest in climate action resilience by re-channeling SDR creation for this purpose.[PIN| |The Bridgetown Initiative on the International Development and Climate Finance Architecture calls upon a new issuance of at least 650 billion $ in SDR (about 0.5% of world MER GDP in 2026).] In our view, this UNC issuance of about 0.5% world GDP should be allocated to each country on an equal per capita basis, in the same way as the country dividends allocated by the Global Justice Fund. It should also be noted that the rationale for the reserve-related UNC issuance is likely to decline over time (as the ICU mechanism is put in place and ensures convergence toward current account balance), so that a larger fraction of total UNC issuance (set to the equivalent of 1% of world GDP per year) could be used to finance sustainable development.
 
We should also make clear that the total size of UNC issuance and UNCB balance sheet would deserve extensive deliberation by its governing bodies.[PIN| |With total UNC issuance of about 1% of world GDP per year, and a nominal world growth rate around 5%, the size of the UNCB balance sheet is set to rise and stabilize around 20% of world GDP.] Recent decades have shown that central banks can play a critical role when urgent action is needed to confront unforeseen crises (such as the 2008 crisis and the Covid crisis). As long as new UNC issuance remains sufficiently modest to prevent a significant rise of inflation, and as long as tax revenues and investment income remain the main sources of financing of the Global Justice Platform, it is possible to imagine higher levels of international money creation than those considered here.

3.4 The End of Hegemony, the Emergence of a Multipolar World

The democratic decision-making rules envisioned for the Global Justice Fund and the United Nations Central Bank stand in sharp contrast with the governing principles of Bretton Woods institutions since 1945. In effect, the IMF and the World Bank have been governed since their creation by a form of global plutocracy, in the sense that each country’s voting rights are tied primarily to its wealth and resources (in particular the size of its GDP) rather than to its population. To a large extent, this resembles the wealth-based and income-based voting systems that were applied in many countries in Europe and elsewhere in the 19th century and up until the early 20th century (including in countries like Sweden, where inequality was at the time deeply entrenched in the political system).[PIN| |See Bengtsson (2018) and Piketty (2020, 2022). Between 1865 and 1911, the number of votes an elector had in Sweden depended on how much tax he paid and how much property and income he had. Within the 20 percent of men rich enough to be able to vote, electors were divided into forty groups, each associated with a different electoral weight.  Members of the least wealthy group each had one vote, whereas those in the richest group had as many as fifty-four votes each. A similar system was used for municipal elections, but with no ceiling, and with the additional particularity that corporations also had the right to vote, with a number of votes depending on the amount of their taxes.  In practice, there were several dozen municipalities in which a single elector has more than 50 percent of the votes.] The shift from global plutocracy to global democracy which we envision for the 21st century in the context of the Global Justice Platform has in our view the same status as the shift from national plutocracy to national democracy which took place in the 20th century.
 
Several remarks should be made about this transformation. Generally speaking, we stress that the current international system faces a serious legitimacy problem and that it is a lot more fragile and unstable and much less frozen than is commonly thought. First, the exact formula used to compute voting rights at the IMF since 1945 is a multi-factor formula including population (so-called “basic rights”), gross domestic product and economic openness (trade and financial flows).[PIN| |The formula used at the World Bank and in other multilateral development banks follows a similar logic, but with a number of specific features. Here we focus on the case of the IMF. See Druschke and Nievas (2026) for a detailed analysis of the formulas and the evolution of the structure of voting rights.] The exact weights used for each factor have changed significantly over time and will continue to do so. For instance, the “basic rights” made 10% of total voting rights in 1945, down to 5% in 2025. The most important change in the recent period is the introduction of PPP GDP in the 2008 reform.[PIN| |Since 2008, the notion of GDP used in the IMF formula is 60% PPP-based and 40% MER-based.] We describe on Figure 3.6 the general evolution of IMF voting rights since its creation. As one can see, the dominant weight of GDP, trade and financial indicators in the formula implies that Europe and North America/Oceania have always had a majority of voting rights (over 70% in the 1950s, and close to 55% in 2025).

Within this general framework, however, it is striking to see that the voting rights going to the United States have declined markedly, from about 35% in 1945 to 17% in 2025, in line with the decline in the US share in world GDP (Figure 3.7). The fact that the US voting share is closer to their PPP share in world GDP than to their MER share reflects a number of factors, including the “basic rights” effect, the introduction of PPP GDP in the formula in 2008, and the fact that openness indicators make a smaller share of GDP in the US than in smaller European economies. The important point is that the US vote share is quickly declining and is now getting close to 15%. This threshold plays a critical role in IMF Statutes, as it grants veto power for the Fund’s most important decisions, in particular regarding the creation of new Special Drawing Rights (SDR). In other words, when the US vote share falls below 15%, the rest of the world can decide to create large quantities of SDR and to increase its economic role (e.g. by deciding that it can be used as unit of account for international trade), and by doing so to substantially transform the world monetary landscape, even with US opposition.

It should also be stressed that the decline of US influence and IMF vote share is likely to accelerate in the coming decades. According to our benchmark scenario, the US share in world GDP is set to decline from 15% in 2025 in PPP terms (23% in MER terms) to about 10% by 2050-2060 and around 5% by 2100, i.e. the same level as the country’s population share (Figure 3.8a). This will happen less fast if the process of global convergence takes place at a slower pace than what we envision in our benchmark scenario, but, in any case, the decline observed over the 1945-2025 period will continue in the future. As a consequence, the US will soon pass below the 15% threshold in voting share and therefore to lose their veto power on SDR creation and other strategic decisions. Note that the IMF formula for voting shares is generally applied with some time lags, as countries need to agree to reorganize the quota system and exchange shares if needed. But it has always been applied in the past, resulting into a massive long-run decline in US vote share (Figure 3.7), and it will be very difficult for the US to block the application of IMF Statutes in the future. If they try to do so for too long, they will face major pressure from the rest of the world, and in particular a mounting threat from China-led BRICS coalition to set up an alternative set of international economic and financial institutions.

Unsurprisingly, Europe’s share in world population and GDP will also continue to decline in the future (Figure 3.8b), implying that the region will need more than ever to be part of larger coalitions.

Regarding China, it is worth emphasizing that their share in world GDP is currently about 20% in PPP terms (about one third higher than the US) and is scheduled to be twice as large as the US by 2035 according to our benchmark projections. However, China’s population share is falling very fast, from 23% of world population in 1945 to about 17% in 2025 and less than 8% in 2100. As a consequence, the share of China in world GDP is projected to stabilize and decline in the second half of the 21st century, and to be overtaken by India around 2060 (Figures 3.8c-3.8d). In any case, China is very unlikely to ever reach the kind of hegemonic position which the US had in the world around 1950 (with as much as 35-40% of the world’s GDP) or which Europe had around 1900-1910 (around 40-45% of the world’s GDP). In brief, the world is set to be multipolar in the 21st century, unlike the worlds of the 19th and 20th centuries.

3.5 The Global Justice Platform and the End of Global Plutocracy

To summarize, the democratic rules envisioned for the Global Justice Fund do stand in sharp contrast with the current plutocratic rules applied at the IMF and other international institutions, but the point is that these rules are already deeply contested and inherently unstable. The dominant power of the post-1945 era – namely the US – has lost a lot of its former power and influence, and the entire system has entered into an era of strong turbulence, structural crisis, and deep realignment. The world is entering a long-lasting era of multipolar rule. It seems about time for a reset.
 
In light of the urgency of the climate crisis, the best approach in our view is to favour a complete change in paradigm, with an immediate shift to global democratic rules. This could be achieved via our proposed double majority system, whereby all regular budgetary decisions made by the Global Justice Fund must be approved by 55% of countries representing 60% of the world population. Other variants based upon clear democratic principles and excluding all GDP-related voting rights could also be considered. Ideally, these new democratic voting rules should and could also be applied immediately to other international institutions. Regarding the Global Justice Fund, the risk is that some countries – especially some of the richest countries – will refuse to participate to the project altogether if it comes with a fully democratic governance. In our view, however, it is preferable to create the Global Justice Fund or the UN Central Bank with an incomplete coalition of countries (possibly without the US and/or without China) and with full democratic rules rather than the opposite. We will later return on the conditions under which the Global Justice Platform can be achieved with an incomplete coalition of countries.
 
In order to obtain the support of all countries which are currently members of Bretton Woods institutions, one could also envision another strategy, namely a gradual transition from global plutocracy to global democracy. The Global Justice Fund would start with the same voting rules as those implied by the current IMF formula, and the country vote shares would then linearly evolve from this initial allocation to a full population-based allocation over the 2026-2050 period. The resulting evolution of vote shares is described in Figures 3.9-3.10. In effect, we would gradually move from a system where each inhabitant of Europe and North America/Oceania has about 16 times more votes than each inhabitant of Sub-Saharan Africa and South and Southeast Asia to a system where all inhabitants of the world have the same voting power.   

This alternative strategy could work, but it also involves major risks. On the positive side, this could be a way to bring all countries on board in a gradualist manner. There are two main problems, however. First, unless this is strongly guaranteed by the GJF Charter, there is a serious risk that rich countries will try to maintain the GDP-based voting system and postpone the transition indefinitely (i.e. push back the democratic target year 2050 to 2080 or 2100). Given that the GJF aims to reach global economic convergence by 2100, it will be tempting for rich countries to argue that there will be no difference between a GDP-based and a population-based voting system by 2100, and that it is preferable to wait for this gradual GDP-based transition to equal voting rights. Next, and most importantly, the problem with this gradual transition to global democracy is that this will prevent the right policies to be adopted in the first place. In particular, in the event that the GJF is controlled by rich countries in the early years, there is a serious risk that they will adopt a very minimalist version of the GJF budget (say, with a small global wealth and income tax and reduced country dividends), or that they may even oppose the principle of equal per capita country dividends and prefer instead to have dividends in proportion to GDP (unless the GJF Charter disallows them to do this). One of the great lessons of the march toward equality at the national level in the 20th century is that political reforms and political equality were put in place before the movement toward socioeconomic equality could begin – not after. Without a decisive move toward global democracy, there is a high risk that the GJF – or any similar system – will never be able to deliver global socioeconomic convergence.  
 
Finally, while the Global Justice Fund and the United Nations Central Bank are the two main pillars of the new international order which we envision in the context of the Global Justice Platform, it would be preferable if the transformation of the international order could also involve a coordinated reform of other institutions, including the World Bank, the World Trade Organization and the International Labour Organization. Ideally, the new democratic governance rules envisioned here, i.e. the double majority system (55% of countries representing 60% of population), should apply all institutions, including the United Nations.[PIN| |In our view, the resolutions adopted by the UN General Assembly would have more weight if they were based on this double majority system. Importantly, building a democratic international order also requires the abolition of any veto power, starting by the UN Security Council.] Organizations which were historically restricted to rich countries (like the Organization for Economic Cooperation and Development (OECD) and the International Energy Agency) should be open to all countries and follow similar democratic rules, especially if they ambition to address global issues.[PIN| |For instance, it is difficult to understand why the discussion about international tax cooperation should be left to a group of rich countries meeting at the OECD rather than in the context of a UN Framework Convention on International Tax Cooperation, in line with the agenda followed by a large majority of world countries in recent years, with the support of coalitions like the Tax Justice Network and ICRICT.] The new international order should also include the reset of dispute settlement mechanisms, with a general priority given to public courts rather than private arbitration.[PIN| |See Hassani (2025).] Last but not least, it should be noted that the large financial resources allocated to the Global Justice Fund (and to a lesser extent to the United Nations Central Bank) would de facto create a major transformation of the entire system of UN agencies and international institutions. In particular, it is clear that the Global Justice Fund and the World Sovereign Fund would have the capacity via country dividends and investment flows to play a major role to push for higher social and environmental standards in labour regulations, trade agreements, energy systems, production norms, and so on.

Chapter 1. Defining the Target: Equality & Prosperity Within Planetary Boundaries in 2100

The Global Justice Platform aims to combine two key goals: socioeconomic equality and planetary habitability. We start by defining our basic objective in terms of shared prosperity. Namely, global income convergence to 60,000 Euros (PPP 2025) per year (5,000 Euros per month) for all countries by 2100 (Chap. 1.1)[PIN| |All amounts in the report are expressed in 2025 PPP Euros, using the latest international macroeconomic data and price surveys in order to estimate purchasing power parities]. We then examine the conditions under which this can be achieved while limiting global warming below 2°C. We distinguish between two sets of climate levers. The first, what we call « sufficiency », is defined as a major structural transformation of the economy, including a substantial reduction in working hours (Chap. 1.2), a large shift in consumption and production from material to immaterial sectors (especially education/health) (Chap. 1.3), and a significant change in food patterns, land use, and forest cover (Chap. 1.4). The second lever consists of climate investment and technological advances to decarbonize energy systems (Chap. 1.5). We finally discuss alternative scenarios in Chap. 1.6, and the evolution of global emissions and temperature across these scenarios. We find that both sufficiency and fast energy transition are necessary in order to limit warming below 2°C: changing energy systems alone is not enough (Chap. 1.7)[PIN| |This Chapter aims to synthetize some of the material that is presented in a more detailed manner in Chancel et al (2026). We refer all interested readers to this work and to the online replication package].

1.1 Target 2100: Reconciling Equality, Prosperity & Material Sufficiency

The basic objective of the Global Justice Platform regarding equality and prosperity is described in Figure 1.1: full income convergence across all countries by 2100 to a level equivalent to that of today’s richest countries. While per capita monthly gross national income ranges from 290 Euros in Sub-Saharan Africa to 4,590 Euros in North America and Oceania in 2025, it reaches 5,000 Euros per month everywhere by the end of the 21st century, according to our benchmark scenario.

Achieving this target implies annual GDP per capita growth rates of around 0-0.5% in today’s richest regions (North America and Oceania, Europe) and around 3-4% in today’s poorest regions (Sub-Saharan Africa, South and South-East Asia), the latter comparable to the average growth rate of East Asia across the last 75 years (Figure 1.2)[PIN| |In order to simplify the presentation, we concentrate on regional and world averages in the context of this report. All detailed country series are available online on GlobalJusticeProject.wid.world].

The justification for proposing a global convergence target is twofold. First, several non-Western countries are already well engaged in – or in some cases have already completed – a trajectory of convergence in per capita GDP with the richest Western countries. All Global South countries aspire to economic prosperity, and any analytically credible and politically viable framework for global climate cooperation must account for this aspiration. Second, the target of 60k Euros per year follows directly from our projections of the environmental impacts of global income convergence. As discussed in greater detail below, converging to this level is consistent with staying within a 2°C carbon budget, but it will require both significant structural transformation and massive investment in low-carbon energy infrastructure. Global convergence to a higher level of GDP per capita may not be feasible within reasonable climate targets. Convergence to a lower target (e.g., 15k or 30k Euros rather than 60k) could lead to further reductions in GHG emissions, but, as we shall see, what matters most is the structural transformation of the economy: targeted sufficiency can be more effective than large, uniform degrowth.

It is worth noting that near-zero growth in today’s richest countries does not imply that the well-being of their populations is set to stagnate over the 21st century. First, accounting for the value of additional leisure time and the avoided costs of climate damages relative to high-growth, high-warming scenarios, even today’s richest countries will enjoy a substantial rise in comprehensive well-being indicators between 2026 and 2100. Second, as described in greater detail in Chapter 2, the Global Justice Platform models strong inequality compression not only between but also within countries, meaning that even in today’s richest countries, a large share of the population will see their monetary incomes rise over the next decades.

1.2 The Structural Transformation of Work: Toward Gender Equality

The first element of sufficiency in the Global Justice Platform is a significant reduction in global economic working hours per employed individual, from about 2,100 to 1,000 hours between 2025 and 2100 (Figure 1.3). Following Andreescu, Loubes et al (2025), all countries are also projected to converge toward full gender equality in economic labour hours – including similar employment rates for men and women – and domestic labour hours (Figure 1.4).

In line with historical experience, the reduction of working hours is made possible by productivity growth. In our benchmark scenario, we assume that hourly GDP converges to 125 Euros across all countries by 2100. This corresponds to relatively low productivity growth rates in Europe and North America/Oceania (0.8-0.9% per year between 2025 and 2100) and to substantial productivity growth rates in the world’s poorest regions (as much as 4.5% per year in Sub-Saharan Africa). Note that these catch-up growth rates are not larger than those observed in East Asia over the 1990-2025 period (4.7% per year). More generally, we observe annual productivity growth rates of around 4%-5% (or more) in all world regions that have experienced accelerated productivity convergence in the past, whether we consider East Asia in 1990-2025 or Europe in 1950-1990[PIN| |See Chancel et al, 2026, Figure 4 & Table 10. Global hourly GDP is about 20 Euros in 2025. It ranges from 4 Euros in Sub-Saharan Africa to 66 Euros in Europe and 68 Euros in North America/Oceania].
 
There are two broad reasons why individual countries and the world as a whole might choose to reduce working hours in the coming decades. First, countries have historically used a significant share of their long-run productivity gains to enjoy more leisure rather than to increase consumption. Second, the mounting threats to planetary habitability provide an additional rationale for reducing labour hours and limiting the economy’s material footprint. According to our benchmark projections, 44% of global productivity gains will be used to reduce labour hours over the 2025-2100 period, which is only slightly more ambitious than what happened in the past: 32% on average over the 1800-2025 period, and as high as 40% over the 1860-1980 period, which corresponds to the peak period of working-class mobilization for labour time reduction[PIN| |See Chancel et al, 2026, Table 11].
 
Needless to say, the fact that the projections for labour hours and productivity are consistent with past experiences does not imply that they are easy to implement. They require specific sets of policies and institutions (including ambitious labour-hours legislation and massive investment in education, health and infrastructure), and most importantly, specific sociopolitical coalitions supporting these policies.  The reduction in labour hours was driven by very strong collective mobilisation and legislative action over the 1800-2025 period, and the same will likely be needed in the future.      
 
Lastly, gender equality – in terms of employment rates, as well as economic and domestic working hours – is an objective that is very important among younger generations in many parts of the world, much like working time reduction and the preservation of planetary habitability, yet it remains difficult to achieve. Achieving it will also require enormous political mobilizations and far-reaching changes in institutions, public policies, and social norms. Several existing policy tools in favour of gender equality should be systematized and reinforced, including equal parental leave, anti-discrimination rules, and gender quotas for job promotion. More radical tools are likely to be needed to rebalance power relations within households, including fiscal equalisation of income between women and men[PIN| |The fiscal equalization of incomes within couples (or at least a very sharp compression of the gap, via differentiated rates of taxes/transfers levied at source on pay slips) could be imposed as default rule, unless both partners agree otherwise. See Aura (2005) for a comparable reform of survivor benefits in the context of the US Retirement Equity Act of 1984, with large redistributive impact]. Generally speaking, the policies aiming at compressing income and wealth scales, which we will present in Chapter 2, are also complementary to gender equality objectives, given that men are vastly over-represented at the top of the income and wealth distribution.
 
We should also make it clear at the outset that the worktime reduction target is entirely determined by the objectives of emancipation and sustainability. If labour relations and production techniques can be reorganised so that longer working hours are no longer associated with subordinate, painful tasks and a larger material footprint, but rather with fully egalitarian, emancipatory, and immaterial tasks, then worktime reduction may no longer be as desirable[PIN| |The way we model the evolution of sectoral inputs and material footprint is arguably too conservative, in the sense that we project future input-output matrices on the basis of past trends. See Chancel et al, 2026, Figures 25-27. In effect, we are barring the possible development of production techniques where lower material input intensity would be compensated by higher labour intensity. On the other hand, it is difficult to make consistent and realistic assumptions about input-output matrices departing radically from observed trends at the country and world levels. This is a key issue for future research].

1.3 Dematerializing the Economy: Education, Health, Culture and Other Services

As the second element of sufficiency, the Global Justice Platform projects that the share of material sectors in gross national expenditure (final consumption and investment) will be reduced by about one third – from 53% to 35% of total expenditure – at the world level between 2025 and 2100 (Figure 1.5), as well as a 40% rise in the share of Education/Health within immaterial sectors.

In the context of the world multisectoral input-output database, which we have constructed for the Global Justice Project, material sectors comprise Food, Housing and Construction, Manufacturing, Energy, and Transport; immaterial sectors comprise Education and Health, Leisure and Culture, and Other Services (Figure 1.6). Immaterial sectors generate almost no direct GHG emissions in their own production processes, and even accounting for the energy and material inputs they rely on, their emissions intensity remains approximately three to four times lower than that of material sectors[PIN| |See Chancel et al, 2026, Figures 3a-3d]. This is why a structural transformation toward immaterial sectors should play an important role in mitigating climate change.

The consumption shift envisioned for the coming decades constitutes a sharp departure from historical trends. Between 1970 and 2025, the share of material sectors in global gross national expenditure remained stable at 53%, and we observe a similar trend in most regions of the world. This stability can be explained by the so-called “Baumol effects”. Because they experience faster technical progress, the relative price of the goods produced by material sectors tends to fall over time in comparison to immaterial sectors (Figure 1.7). These falling prices help maintain high and rising demand and offset satiation effects, so that, at the end of the day, the share of material sectors in final consumption expenditure (in volume terms) does not decline, and may even rise in some cases, even though material needs are more than satisfied[PIN| |See Odersky (2025) for a more detailed analysis of « Baumol effects » vs. « Engels effects »]. If we were to use current relative prices, as is often done, then we would naturally find a decline in the share of material sectors in total expenditure between 1970 and 2025. But by using constant relative prices, a better way to measure the volumes of the various goods and services (and their consequences for GHG emissions and global warming), the striking finding is that there has been no dematerialisation of the global structure of expenditure over the past half-century.  

This finding has major implications. In particular, it implies that there is no reason to expect market-driven economic development to lead to a major shift from material to immaterial sectors in the future.
 
In order to address this, the usual policy advocated by many economists would be a large corrective tax/subsidy scheme to raise the relative price of material goods and services relative to immaterial goods and services. In our view, however, there are several problems with this corrective tax solution. First, the tax would need to be very large. This means that, to counteract the enormous long-run decline in the relative price of manufacturing goods (say, compared to education/health), we might need a tax of the order of 200-300% or more. Next, a common problem with corrective carbon taxes – especially when they become so large – is their adverse distributional effect. In theory, it is always possible to neutralize these adverse effects by distributing part or all of the revenue to lower income groups. However, in practice, such promises often go unfulfilled, so that low- and middle-income households tend to have a very negative perception of these policies (largely for good reasons).
 
One way to address these concerns is to use non-linear corrective taxes that vary with the quantity of food, manufactured goods, or energy purchased over a given period, thereby implementing progressive price schedules, including low prices for the first units purchased by households and much higher prices for large consumers. For instance, the first units of electricity consumption are affordable, but the following ones are not; the first airplane flights over one’s lifetime are affordable, but the following ones are not; and so on[PIN| |This is reminiscent of the famous progressive expenditure taxes advocated by Kaldor (1955) in a different context, i.e. in order to supplement the highly progressive income and inheritance tax system that was in place in Britain at the time]. Like all progressive taxes, this requires more information than flat proportional taxes do, but this does not imply that it is infeasible.  
 
Another limit of the standard corrective tax logic is that it tends to put excessive emphasis on price signals. In some cases, direct quantity controls (such as a fixed number of airplane flights) or regulations (such as a ban on thermal engines) can be more efficient than changing the price signal. In addition, profit-making logic does not always work well in some of the key sectors that are scheduled to expand in the Global Justice Platform, especially education and health. Rather than using a corrective tax/subsidy scheme on material sectors to change their relative prices (in effect subsidizing the private production of education, health and other services), a better solution might be to raise general tax revenue via progressive income and wealth taxation in order to expand the public education and health sector. In addition to extending the standard public sector, in which local and/or national governments directly organise the provision of free education and health services, one could also use some of the extra tax revenue to finance education and health vouchers, which could then be used to purchase services from the non-profit sector. This tax/voucher-sector logic could also be useful for other sectors, e.g., one might consider using “organic food” vouchers to allow households to purchase food from local producers, subject to certain conditions[PIN| |See e.g. the projects of “food social security” (securite-sociale-alimentation.org)]. This could be used for many other goods and services (including energy, transport, culture, etc.).
 
As compared to the standard market-driven tax/subsidy logic, one additional advantage of the tax/public-sector and tax/voucher-sector approaches is that they allow for more direct margins of action to compress the income scale in the corresponding sectors and production units (whether they are public, private, non-profit, or mixed). More generally, they allow for the pursuit of a gradual “decommodification” of the economy, in the sense that more and more sectors are gradually organised outside the classic, lucrative capitalist logic[PIN| |In his classic work, Polanyi (1944) argues that the process of “commodification” of the economy and the sacralization of markets and competition in the 19th century up until 1914 contributed to the weakening of European societies and to the disasters that followed. Conversely, the construction of the social state in the 20th century is inseparable from a process of decommodification of large sectors of the economy (education, healthcare, research, social security, and to a lesser degree transportation, energy, housing, etc.), particularly in Western and Nordic Europe, a process which could arguably continue in the 21st century and may be well-suited to address ecological challenges. See Piketty (2025)]. As we discuss in Chapter 2, different countries might well make different choices about how they organise the various sectors and the balance between public, private and non-profit governance and property structures, and we do not aim to prescribe a one-size-fits-all approach to these issues.
 
What is critical from our point of view is that all countries are able to sharply reduce the share of material sectors over the course of the 21st century. According to our benchmark scenario, the share of global working hours devoted to education and health rises from 11% in 2025 to 43% in 2100 (Figure 1.8).

While this increase may appear large, it is worth noting that countries such as Norway and Sweden already allocate around 30–35% of labour hours to these sectors today (Figure 1.9). Given the scale of future needs in health and education, driven by population ageing and expanding access to higher education among younger generations, even the projected rise to 43% may well turn out to be insufficient[PIN| |See Chancel et al 2026 for a more detailed discussion of our sectoral productivity growth projections over the 2026-2100 period. In particular, we assume faster automation and productivity gains in leisure/culture and other services than in education/health. Note that the low productivity growth rates observed in housing/construction in 1970-2025 appear to partly reflect transitory effects (and rising housing prices) rather than permanent forces. See Chancel et al 2026, Appendix A].

1.4 Dematerializing the Economy: Reforestation, Land-Use and Food Habits

The third and last element of sufficiency in the Global Justice Platform is a substantial transformation of food patterns, land use, and forest cover. To understand why, it helps to consider today’s land-use patterns. Of all the land on Earth, less than 1% is covered by built-up areas (cities, roads, other infrastructure), while close to 33% is used for agriculture, almost as much as forests (28%) and wild grasslands and shrubs (10%)[PIN| |The rest (29%) is covered by other barren land (mountains, deserts, etc.). See Chancel et al, 2026, Table 8 and Figures 2a-2c for historical evolutions]. Of that agricultural land, two-thirds is devoted to grazing livestock. This makes dietary changes a direct lever to reduce emissions. First, cattle farming alone accounts for 11% of global emissions in 2025, making it far more environmentally costly than producing equivalent calories from plant-based sources. Second, the expansion of grazing land is the primary driver of deforestation, which itself accounts for around 6% of global emissions and destroys one of the planet’s most important carbon sinks[PIN| |See Chancel et al, 2026, Table 9, for detailed breakdown and discussion].
 
Global forest cover declined by approximately 200 million hectares between 1990 and 2025, with no sign of significant deceleration. This trend is sometimes obscured in public debate by the fact that most regions of the Global North have experienced moderate reforestation in recent decades. However, continued deforestation in the Global South, particularly in Latin America and to a lesser extent in Sub-Saharan Africa and South and South-East Asia, has more than offset these gains, resulting in a net loss of around 200 million hectares of global forest cover over the period (Figure 1.10). This is aggravated by the fact that the areas currently undergoing deforestation include denser forests with much stronger CO2 absorption capacity per hectare (two to three times greater) than the areas undergoing reforestation.

In our benchmark scenario, we combine a complete ban on deforestation with a major reforestation program, so that global forest cover gradually recovers from approximately 4.1 billion hectares in 2025 to 4.8 billion by 2100, which corresponds roughly to the level last recorded in 1900 (Figure 1.11)[PIN| |See Chancel et al, 2026, Figures 22a-24c for detailed projections by region].

According to our projections, this implies a 25% reduction in global grazing land (including a 40% reduction in Latin America) and the equivalent of a 25% reduction in total world meat production between 2026 and 2100 (adjusting for land-intensity by meat category). This also includes a substantial fall in today’s richest countries and largest meat consumers, especially for red meat (whose production is more land-intensive). By 2100, red meat consumption in North America is projected to fall by approximately a factor of 4.5, and by around 2.5 in Western Europe. While this may seem large, the point is that the amounts at stake in terms of GHG emissions and global warming are truly enormous, and that there appears to be no other way to proceed to put an end to ongoing deforestation and allow world forest cover to return to adequate levels.
 
Whether it takes the form of a reduction in total labour hours, a compression of the share of material sectors, or a change in food habits and land use, the move toward sufficiency that we advocate in the Global Justice Platform entails major benefits in terms of leisure time and planetary habitability. Still, it naturally also entails some costs for certain consumers and producers. Regarding our projected changes in land-use patterns and reforestation, the main losers are arguably producers in Latin America and Sub-Saharan Africa who have benefited from continuing deforestation in recent decades (Figure 1.10), as well as the owners and consumers of the corresponding companies in the North. The purpose of the Global Justice Fund and the system of country dividends is precisely to ensure that bottom- and middle-income classes in all countries benefit from this process, both in the South and in the North – a central issue which we will investigate in Chapter 2.    

1.5 Dematerializing the Economy: Fast Move Toward Low-Carbon Energy

Together with sufficiency, the Global Justice Platform also requires a fundamental transformation of energy systems. As discussed before, different economic sectors vary in their emissions intensity, that is, in how much carbon and other greenhouse gases (methane, nitrous oxide, etc.) their production processes emit. Shifting toward less material-intensive sectors is therefore an important way to reduce emissions, but it is not enough: the production processes themselves must become cleaner. This means electrifying energy demand wherever feasible (such as transitioning vehicle fleets) and switching to low-carbon fuels (for example, in steel and cement production). Crucially, electricity generation itself must be decarbonised, moving away from fossil fuels toward renewables like hydropower, solar, and wind.
 
How far and how fast this transition can realistically go lies at the heart of one of the defining tensions in contemporary climate debates: the extent to which economic activity can be decoupled from emissions through technology alone. To address this question, we provide a detailed analysis of three different energy transition scenarios, which we summarise in Figure 1.12 and Figure 1.13. These three scenarios – Slow, Intermediate and Fast Decarbonization (SD, ID and FD), the last of which underlies the Global Justice Platform – are based on a detailed input-output decomposition of the energy sector into up to 14 subcategories covering different types of primary energy sources and electricity generation technologies. This approach allows emissions to be tracked through the specific fuel mix of each sector rather than through aggregate emission intensities, yielding a transparent set of assumptions that can be modified independently to construct alternative scenarios or conduct sensitivity analyses[PIN| |See Chancel et al (2026) for a detailed discussion].

The three energy transition scenarios are broadly aligned with those developed by the International Energy Agency (IEA, 2025) but distinct from them in important respects. First, the IEA scenarios extend only to 2050 and are organized around three broad end-use sectors. In contrast, the Global Justice Platform runs till 2100 and is structured around eight main production sectors (see Figure 1.6). In addition, the Global Justice Platform does not assume large-scale carbon capture and removal to achieve net zero, relying instead on reforestation as a natural carbon sink[PIN| |Due to high costs, numerous large-scale demonstration projects of carbon capture have been delayed or abandoned, and the volumes required are enormous relative to anything demonstrated so far. Long-term underground storage carries potential risks of leakage, and suitable sequestration sites are not universally available. Direct air capture faces even greater uncertainty as it remains extremely costly and has barely moved beyond pilot scale. Based on these uncertainties we consider large-scale deployment of both technologies as highly speculative (Jones and Lawson, 2022; Oreskes, 2024), and assume only limited carbon capture at industrial sites in our most optimistic projections]. Unlike the IEA, it also assumes that the share of nuclear power in electricity generation falls by around one third by 2050, given well-documented concerns around safety and waste disposal, with the difference compensated for by a faster expansion of renewable sources, in line with the observed accelerated decline in renewables costs.
 
The SD scenario (Slow Decarbonization) broadly corresponds to the policies currently followed by the countries involved. In line with the latest trends and IEA estimates, this scenario involves a large and persistent use of fossil fuels, whose share in total final energy demand is projected to decline very slowly over time, from 69% in 2025 to 48% in 2100. The ID scenario (Intermediate Decarbonization) is a more proactive scenario that roughly corresponds to country official commitments and pledges, including policies that are not yet implemented, which the IEA refers to as the “STEPS” scenario (stated policies, as opposed to current policies). According to our estimates, the share of fossil fuels declines faster than under the SD scenario but remains substantial in 2100 (39% of total energy demand). In contrast, the FD scenario (Fast Decarbonization) is the most ambitious and is designed to reduce emissions as close to net zero as possible. The share of fossil fuels in final energy demand falls from 69% today to under 20% by 2050, reaching zero before the end of the century. In the meantime, the share of electricity rises from 24% today to 78% by 2100, with the remainder provided by low-carbon fuels (Figure 1.12)[PIN| |See Chancel et al, 2026, Figures 40a-40h for similar projections for each of the 8 production sectors and for the household sector (direct energy consumption of households, primarily for residential heating and personal vehicle use)].
 
The electrification of total energy demand is a key dimension of the energy transition, but it is not enough on its own: higher electrification does not reduce emissions if the additional electricity comes from carbon-intensive sources. Equally important, therefore, is the mix of electricity generation. Under the SD scenario (current policies) and the ID scenario (country objectives), fuel power plants are projected to disappear over the course of the 21st century, but the process is very gradual, so gas and coal power plants still play a major role well beyond 2050. In contrast, under the Fast Decarbonization scenario adopted by the Global Justice Platform, low-carbon sources (wind, solar, hydro, and nuclear power) are projected to rise steeply from 41% of total electricity generation today to 79% by 2035 and to 100% by 2050 (Figure 1.13).
 
Note that the Fast Decarbonization scenario requires massive investment in new technologies and infrastructure, in the order of 3-4% of world GDP annually over the next three decades, according to our synthesis of existing estimates[PIN| |We synthetise and update previous estimates, including those published by Working Group III of the IPCC AR6 (IPCC 2022) and Climate Policy Institute (Buchner et al., 2023; Climate Policy Institute, 2025), who compute total annual climate investment requirements to achieve a net zero scenario based on a review of estimates of the costs to de-carbonize various sectors of the economy]. As we will discuss later, these financial needs should be met in priority by the global rich, who have benefited disproportionately from global economic growth in recent decades and bear a major historical responsibility for the accumulation of GHG emissions.

1.6 Alternative Futures: Productivist Convergence and Persistent Inequality

We compare the environmental impacts of the “Sustainable Convergence” (SC) trajectory promoted by the Global Justice Platform with two alternative scenarios: “Productivist Convergence” (PC) or “Persistent Inequality” (PI). These two alternative scenarios project global convergence at much higher GDP per capita levels (PC) or continued between-country inequality (PI) and abstain from the key sufficiency elements of a reduction in labour hours, shifts in consumption patterns, and changes in food habits. In our benchmark simulations, both are also associated with more modest decarbonization pathways that align with current policies (Slow Decarbonization) rather than ambitious targets (Fast Decarbonization).
 
The Productivist Convergence scenario assumes the same productivity trends as the Sustainable Convergence scenario, but without any reduction in labour hours. As a consequence, all countries converge to a higher per capita GDP level of 120,000 Euros rather than 60,000 Euros. In our view, the PC scenario corresponds to a trajectory with relatively high levels of international cooperation to facilitate cross-country economic convergence (including large investment flows to poor countries), but little political mobilisation to reduce labour hours, total economic output, and material footprint (Figure 1.14a).

In the Persistent Inequality scenario, we assume that there is no reduction in labour hours (as in the PC scenario) and little cooperation and mobilisation to facilitate cross-country convergence, so that global inequality in per capita GDP remains very high until 2100 (Figure 1.14b). Rich countries are richer than in the PC scenario, but poor countries are substantially poorer, especially in Sub-Saharan Africa, so that average per capita GDP is scheduled to be 101,000 Euros, a level that is substantially higher than in the SC scenario (60,000 Euros) but lower than in the PC scenario (120,000 Euros). In line with available studies, we also assume faster demographic transition and fertility decline in poor countries – and therefore a lower world population in 2100 – in global convergence scenarios (SC or PC) than in the PI scenario, so that aggregate world GDP under the PI scenario is even closer to that under the PC scenario[PIN| |Namely, we follow UN medium demographic projections in the PI scenario (with world population rising from 8.2 billion in 2025 to 10.1 in 2070 and 10.2 in 2100) and UN ABR projections (accelerated birth rate decline) under the SC and PC scenarios (with world population equal to 9.8 billion in 2070 and 9.4 in 2100). See Chancel et al, 2026, Figures 7-8]. This Persistent Inequality scenario is arguably closest to a pure “business-as-usual” scenario, in the sense that it does not require any major policy action or change in course. In particular, it requires no international coordination to foster cross-country convergence, no reduction in labour hours to limit consumption, and no compression of the relative size of material sectors.

As we shall see, these two alternative scenarios are likely to lead to catastrophic global warming and a severe decline in planetary habitability. Note that by 2100, the size of the world economy – i.e. the real quantity of goods and services produced in the world – is about twice as small in the Sustainable Convergence scenario as in the two alternative scenarios. The gap is even larger if we focus on material sectors (Food, Construction/Housing, Manufacturing, Energy, Transport), where total world expenditure is almost three times smaller in the SC trajectory than in the other two scenarios (Figure 1.15). In that sense, the Sustainable Convergence scenario represents a significant attempt to apply the principles of material degrowth, at least in relative terms (i.e., relative to alternative high-growth scenarios)[PIN| |In absolute terms, the SC trajectory is naturally associated to large positive growth, since poor countries are scheduled to catch up with the per capita GDP levels of today’s rich countries. According to our projections, aggregate world GDP is scheduled to rise from 139T (trillion Euros PPP 2025) in 2025 to 565T in 2100 in the SC scenario (as compared to 1023T in PI scenario and 1130T in PC scenario). The real growth rate of world GDP, which was equal to 3.2% per year on average between 1970 and 2025, is projected to slow down to 1.9% between 2025 and 2100 in the SC scenario, vs. 2.7% and 2.8% per year in the other two scenarios. While this can seem like a small gap in terms of annual growth rate (with a differential around one percentage point per year), the cumulated effect over the 2025-2100 period is substantial. See Chancel et al, 2026, Figure 43a. Note also that projected growth rates for world per capita GDP over the 2025-2100 period according to our three scenarios fall in the same range as those considered in the SSPs (Shared Socioeconomic Pathways) used in IPCC Reports. The main difference is that SSPs do not consider the possibility of complete convergence: in 2100, the income gap between the poorest and richest regions is around 1 to 3 or more (including in SSP1 and 2). See Chancel et al, 2026, Table 15. Another difference is that SSPs assume a larger population decline by 2100 than all UN population projections. See ibid., Figure 7].

1.7 Projecting Temperatures: Sufficiency & Energy Transition Are Complementary

We can now present our projections for GHG emissions and temperatures under the different scenarios. Our key conclusion is that both sufficiency and a fast energy transition are necessary to limit warming to below 2°C: neither changing energy systems alone nor sufficiency alone will be enough. Conversely, if we continue on the current trends, with no sufficiency and with slow energy transition, then we are heading for catastrophic global warming (4-4.5°C or more).
 
Figure 1.16 compares the temperature outcomes of the Sustainable Convergence scenario associated with the Global Justice Platform against the two growth-focused macroeconomic scenarios described above. Strikingly, under both the Persistent Inequality and Productivist Convergence scenarios, cumulative emissions over the 2025-2100 period reach 7250-7500 GtCO2e, translating into an expected temperature rise of 4.8°C to 4.9°C above pre-industrial levels by the end of the century. Aggregate emissions under the two scenarios are similar because, despite PI involving sustained inequality across countries while PC achieves full convergence to 120,000 Euros per capita, because aggregate global GDP and especially the average growth rates in the first decades are very similar under the two scenarios.

When societies shift to sufficiency, that is, reduce work hours by half by 2100, reorient consumption to immaterial goods, and shift food patterns to allow reforestation, cumulative emissions fall to 3635 Gt CO2e, corresponding to a projected 3.3°C temperature rise by 2100. This represents a significant improvement over the no-sufficiency scenarios but remains well above the 2°C temperature threshold. In the Global Justice Platform, sufficiency in production and consumption patterns must be combined with rapid decarbonization of the energy system. Then, projected emissions fall to 1075 Gt CO2e over the 2025-2100 period, yielding an end-century temperature rise of 1.8°C. To summarize, reconciling global income convergence with planetary boundaries requires simultaneous transformations of socioeconomic structures and energy systems (Figure 1.16).
 
Figure 1.17 puts precise numbers on the drivers of emission reductions. Sufficiency makes up for 44% of the total: 26% from the reduction in global annual working hours, 8% from the shift in consumption patterns toward immaterial sectors, and a further 10% from changes in food habits. The energy transition accounts for 55%, with electrification as the single largest driver, split between a greater share of electricity in final energy demand (10%) and the decarbonization of electricity generation itself (14%). The remaining reductions stem from changes in the composition of primary fuels (16%), efficiency gains (6%), and improvements in industrial processes and waste management (10%). Once again, it is clear that the Global Justice Platform must push for both sufficiency and a rapid energy transition to enable global income convergence while staying within a 2°C carbon budget. 

Figure 1.18 illustrates what happens when the two growth-focused scenarios – which incorporate no sufficiency measures – are paired with an ambitious energy transition. Assume we shift from Slow Decarbonization (which corresponds approximately to current policies) to Intermediate Decarbonization (which is closer to official country commitments but not yet implemented); this shift would already require enormous policy action. The resulting temperature rise would be reduced from about 4.8°C-4.9°C to 4.1°C-4.2°C, which would still be very large[PIN| |These temperature projections are very high but comparable to the projections presented in IPCC reports under the worst SSP scenarios. Note also that we include in our projections the latest estimates regarding the persistent use of fossil fuels in the coming decades. Other assumptions – including limited carbon capture and population decline, and relatively high growth in poor countries – can also contribute to explain the remaining gaps with other available estimates]. Let us now assume, for the sake of reasoning, that the PI and PC scenarios can be combined with Fast Decarbonization. Projected temperature rise by 2100 falls from 4.8°C-4.9°C to around 2.6°C. This is a substantial improvement, but it falls short of what is needed. In particular, GHG emissions do not reach net zero by the end of the century under these scenarios, meaning that global warming would continue well into the next century[PIN| |According to our extended projections, emissions continue to grow thereafter, and temperature rise could reach around 2.9°C-3.0°C by 2200, because of remaining industrial emissions and emissions from livestock farming that are not fully offset by forests. See Chancel et al, 2026, Figure 48. From a purely technical perspective, these scenarios demonstrate that accelerated transformation of energy systems and industrial processes can reduce emissions substantially by the end of the century even without the sufficiency elements that characterize our SC scenario but cannot reach net zero emissions].
 

In any case, we remain sceptical of such “green growth” pathways for two main reasons. First, there are other planetary boundaries beyond climate change (biodiversity loss, nitrogen and phosphorus cycles, freshwater depletion, ocean acidification) that cannot be avoided through decarbonization alone, and several of which have already been transgressed (Richardson et al., 2023). A pathway that maintains material consumption growth at current rates while decarbonising production processes will only further transgress these boundaries by continuing to exert pressure on ecosystems, resource extraction, and pollution. Decarbonization is necessary, but not sufficient, for comprehensive planetary habitability.
 
Second, we question whether such pathways are culturally and politically feasible without the kind of societal transformation that sufficiency entails. Fast decarbonization requires rapid retirement of high-carbon assets, massive investment in renewable energy, substantial increases in energy costs during the transition, and industrial policies that restrict consumer choice. These are disruptions that are difficult to sustain without a compelling vision of why they are worthwhile. The sufficiency narrative of the Global Justice Platform aims to provide precisely such a vision. Rather than framing decarbonization as a sacrifice in the service of continued material accumulation, it reframes the transition as an opportunity to build a more equitable and sustainable way of life. Working fewer hours and in a gender-equal way, reorienting consumption toward services (especially education/health), eating in a more sustainable (and healthy) manner, sharing prosperity globally, and living within a stable climate can plausibly increase human well-being compared to the trajectory of endless work and material growth. As societies shift in this direction, industries tied to material output shrink relative to those providing services, shifting the balance of political power, and making ambitious climate policy easier to sustain. Fast decarbonization and structural transformation are, in this sense, mutually reinforcing forces.
 
Figure 1.19 reinforces this point from a different angle. It shows projected emissions and temperatures under fast decarbonization, but global convergence to different GDP per capita levels, with and without sufficiency. The results are telling: targeted sufficiency can be more effective than aggregate degrowth. For instance, a 60k target with a large shift in consumption to immaterial sectors, changes in food habits, and implied deforestation leads to a 1.8°C temperature rise in 2100, i.e., less than the 1.9°C associated with a large uniform degrowth (15k for all in 2100) but without structural change. In other words, the sectoral composition of production and consumption patterns matters – and not only the level of GDP. We therefore argue that integrating the cultural transformation that sufficiency brings into public discourse may not only be more politically viable – in the sense that it offers society a positive vision of what replaces material sacrifice – but also be more effective environmentally.

From a methodological viewpoint, these results illustrate the fact that multidimensional material accounting – emphasizing sectoral shares, work hours, GHG emissions, land-use patterns, etc. – is, in many ways, more relevant than single-dimensional monetary accounting. Computing synthetic monetary indicators – including income and wealth scales between and within countries – can also be informative and even play a crucial role in collective discussion and democratic deliberation (for instance to evaluate the proper level of income and wealth inequality and progressive tax rates), but only under the condition that we always make explicit the material counterpart to these computations, and the fact that different social valuations for the various subcomponents would naturally lead to different monetary aggregates[PIN| |For instance, all GDP targets used here (15k, 60k, 120k, etc.) are based upon the structure of relative sectoral prices prevailing in 2025. Using other relative prices (e.g. a higher relative value for education/ health than for material goods) would lead to other figures. Also, by adding plausible lower-bound valuations for leisure time and planetary habitability, we find that augmented per capita GDP in 2100 is higher in all countries in SC scenario than in PC & PI scenarios. See Chancel et al, 2026, Fig. 51a-51b].

Chapter 2. How to Get There: The Global Justice Fund 2026-2100

To reconcile equality, prosperity, and planetary habitability, the Global Justice Platform must address several key challenges. In particular, the “Sustainable Convergence” trajectory described in Chapter 1 requires substantial resources to finance expenditures on education, health and climate infrastructure. The Global Justice Fund (GJF) is the centerpiece of the Global Justice Platform and the key institution responsible for addressing these challenges. It is designed as a new international institution dedicated to global socioeconomic convergence and to financing sustainable development and the energy transition at the global scale. Its key objective is to ensure equitable development opportunities for all countries while limiting global warming to below 2°C and sustaining political support from low- and middle-income classes in both the North and the South.
 
We first describe the general architecture of the Global Justice Fund (Chap. 2.1). We then proceed with country dividends and their impact on access to education and health (Chap. 2.2), the World Sovereign Fund and the new balance between public and private wealth (Chap. 2.3), and the global wealth and income taxes and their impact on inequality (Chap. 2.4-2.6). Finally, we show that a vast majority of the population – about 95-98% in the Global South and 85-95% in the Global North – benefits from rising monetary incomes in our benchmark trajectory, but with large variations across countries and scenarios, potentially implying fierce opposition from beyond just the ultra-rich (Chap. 2.7)[PIN| |This Chapter aims to synthetize some of the material that is presented in a more detailed manner in Bothe et al (2026). We refer all interested readers to this work and to the online replication package].

2.1 The Global Justice Fund: A Tool for Equality and Sustainability

Figure 2.1 describes the overall organization of the Global Justice Fund. In short, the GJF is responsible for raising adequate revenues (via global wealth and income taxation), managing a World Sovereign Fund (made up of previously accumulated tax revenues) and distributing country dividends (allocated to each country on an equal per-capita basis and used to finance climate investment, education and health expenditures).

In our benchmark scenario, total GJF revenues and expenses represent around 8-10% of world GDP on average over the 2026-2060 period, with higher figures for the first decade (14%) and lower values for the second half of the century (5%). This represents far more resources than the total combined resources currently allocated to development aid or international organizations (less than 0.4% of world GDP) (Figure 2.2)[PIN| |World GDP is projected to be about 140 trillion Euros (PPP) in 2026, which means that GJF revenues and expenses are scheduled to be of the order of 12-14 trillion Euros in the coming years. Note however that all nominal amounts are quickly changing, due both to price inflation and real growth, so it is highly preferable to express all amounts as fractions of world GDP or other relevant denominators, as we do in the present report. All series expressed in money amounts are available online]. While this may seem large, the point is that it includes not only climate investment needs (about 3-4% of world GDP per year in the coming decades) but also new education and health expenditure aimed at fostering global convergence. As we show below, this still falls short of what equal access to education and health would require.

The overall structure of GJF revenues and expenses, and their projected evolution over the 2026-2100 period, are described in Table 2.1 and Figures 2.3a2.3b. We summarize the broad contours here, starting with revenues and then moving to expenses (each of these elements are laid out in greater detail in subsequent sections). GJF revenues come from a global wealth tax, a global income tax, and the investment income coming from a World Sovereign Fund (WSF), which itself is accumulated out of previous tax revenues. The global wealth and income taxes come in addition to national tax systems and target the top of the global distribution (typically over 10-20 times the world average wealth and income levels; around 1% of the world population).

Several points are worth stressing about GJF revenues. First, wealth tax revenues play a crucial role during the 2026-2035 period (as much as 8-10% of world GDP in annual revenue on average in 2026-2029, and 4-6% per year in 2030-2035) and then become gradually less important over time. In effect, the global wealth tax generates substantial payments from top wealth holders – especially decamillionaires, centimillionaires, and billionaires – between 2026 and 2035, and these payments are primarily used to accumulate assets in the WSF. In turn, these assets generate investment income, which gradually becomes more important than tax revenues. By 2050, wealth tax revenues account for 1.0% of world GDP, income tax revenues for 0.9%, and investment income for 5.8%. By 2100, all GJF revenues come from investment income (4.2% of world GDP) (Figure 2.3a). We will return below in more detail to the projected structure of wealth tax rates and tax payments.

It is worth stressing that projected revenues from the global income tax also play an important role but are significantly smaller than those from the global wealth tax, especially in the early period of the GJF. Between 2026 and 2035, income tax revenues account for an average of 4.0% of world GDP per year, compared with 6.8% for the wealth tax and 3.3% for investment income. Between 2036 and 2060, both the global income tax and the global wealth tax raise 1.6% of world GDP per year, compared with 5.5% from investment income. Over the 2060-2100 period, tax revenues in general become almost negligible (0.1% of world GDP per year for the wealth tax, 0.4% for the income tax) compared with investment income (4.8%) (Table 2.1).
 
There are several reasons why the Global Justice Platform places greater emphasis on the wealth tax than on the income tax. First, the rise in top wealth concentration has been particularly spectacular in recent decades,[PIN| |See the World Inequality Reports 2018, 2022 and 2026 coordinated by Alvaredo et al (2018) and Chancel et al (2022, 2026) (all available on wid.world)] and governments have done very little to address it. One standard explanation is that national governments – who were the main actors behind the liberalization of capital flows[PIN| |See Abdelal (2007)] – now find it difficult to tax highly mobile top-wealth owners on their own. The Global Justice Fund, by relying on a common global wealth tax, offers an opportunity to circumvent these difficulties. In comparison, national governments face relatively fewer difficulties in redistributing income (via taxation and other tools like labour market rules), at least up to a point, so it is logical to rely more on the national level for income-related policies and more on the global level for wealth-related policies[PIN| |It must be noted, however, that national governments should in our view develop progressive wealth and income taxes on their own, in addition to the global taxes. See Chapter 2 on national policies]. Next, given that one of the key objectives is to build up a substantial sovereign fund and transform property structures, it makes sense to rely more heavily on a global wealth tax than on a global income tax, especially at the beginning of the asset accumulation process. 
 
Turning to GJF expenses, they take two forms: country dividends (allocated to each country on an equal per-capita basis and used to finance climate investment, education, and health expenditure) and gross investment flows accumulated in the WSF. During the early years of the GJF (2026-2035), most of the revenues collected through global wealth and income taxes are devoted to investment flows and the buildup of the sovereign fund (Figure 2.3b). The objective is for the size of the WSF to reach about 60% of world GDP in assets by 2035 (about 10% of the world capital stock) and then stabilise around that level. Starting in 2050, WSF investment flows are set to equal exactly one-tenth of the aggregate world investment flows projected in our benchmark “Sustainable Convergence” scenario, so that, by construction, WSF assets stabilise at about 10% of the world capital stock (more on this below)[PIN| |Aggregate gross investment flows are projected to rise from 27% of world GDP in 2025 to 31% in 2050 (reflecting the increased investment in climate and infrastructures and the accelerated convergence process), and then to decline to 20% by 2100 (reflecting the decline in aggregate economic growth, especially the zero or slightly negative population growth). Aggregate capital stock is projected to rise from 521% of world GDP in 2025 to 600% by 2100. See Chancel et al (2026), Figures 10-11].

In effect, over the 2026-2035 period, nearly two-thirds of GJF expenses (8.4% of world GDP) would be directed towards building up the WSF asset base, while country dividends start at relatively low levels and rise only gradually. Subsequently, over the next 25 years (2036-2060), once the WSF base has been built up, more fiscal space would be available for country dividends, which would account for two-thirds of total GJF expenses (5.7% of world GDP). Finally, over the 2060-2100 period, country dividends and flows into the WSF would each account for about half of GJF expenses (2.7% of world GDP) (Table 2.1).

2.2 Country Dividends: The Long March To Equal Access to Education & Health

The Global Justice Fund allocates country dividends to finance climate investments, as well as education and health expenditures. Country dividends are assumed to be distributed on an equal-per-capita basis, so that the geographical distribution of country dividends, by construction, follows the distribution of population across regions. In our benchmark scenario, country dividends represent 4.1% of world GDP on average over the 2026-2100 period, including 5.7% on average in 2036-2060 (and up to 8-9% around 2030-2040, when a big push in new climate investment and education and health expenditure is particularly needed) and 2.8% in 2061-2100 (when global socioeconomic convergence is already well advanced) (Table 2.1).

Given that country dividends are distributed on an equal per-capita basis, they represent a smaller fraction of GDP in rich countries than in poor countries. They make up, on average, 2.2% of GDP in North America/Oceania and 2.5% in Europe over the 2026-2100 period, compared with 5.4% in South & South-East Asia and 8.8% in Sub-Saharan Africa.  The gap is particularly large in the early period (when income inequality between regions is enormous). It is shrinking in the second half of the 21st century (as a consequence of income convergence)[PIN| |See Bothe et al. (2026), Table 3, Figure 6 and Appendix Figure E2b].
 
In our view, country dividends should come with strong conditionalities. Namely, the key objective of the Global Justice Fund is sustainable convergence, and country dividends should be used to finance the new climate investments and human capital expenditure needed to implement this trajectory. Given these objectives, the conditionalities should arguably be based for the most part in terms of measured outcomes, with particular focus on climate targets (investment in low-carbon energy infrastructures, GHG emissions, end of deforestation), human capital targets (education and health expenditure) and inequality targets (distribution of income and wealth). The monitoring of income and wealth inequality is particularly critical, first to properly implement global wealth and income taxes, and next to ensure that country dividends are well used and do not disproportionately benefit the most affluent social groups, either in the public or private sector. Whether the conditionalities should also include explicit sufficiency targets (including reductions in work hours, a shift from material to immaterial sectors, and changes in food habits), or focus only on the resulting GHG emissions, is an open question that should be democratically discussed and decided within the context of the GJF.
 
We present here one possible distribution of country dividends (expressed as a % of world GDP and in constant Euros) between the different expenditure items consistent with the objectives of the Global Justice Platform (Figures 2.4a-2.4b). This split of country dividends into climate investments, health expenditures, and education expenditures is intended to be illustrative of the magnitudes involved. It should ultimately be decided by countries themselves, at least in part. In our view, countries should be given significant degrees of freedom on how to use the country dividends in relation to their other public revenues and expenditures (as long as they achieve the goals set by the GJF). In particular, there are different organisational forms and property structures (including various combinations of public, private, non-profit, and participatory governance) that can be used to deliver the same outcomes in areas such as climate, energy systems, education, and health. There is no reason, from the GJF perspective, to overly restrict country-level experimentation in this area. In our benchmark scenarios, roughly half of these country dividends are to be directed to climate investments and the rest towards health and education expenditure.

One of the central objectives of the Global Justice Platform is to promote equal access to high-quality education and health. As a general goal, all children and all human beings should have access to the widest possible opportunities in terms of education and health – and in principle to equal opportunities, in line with both the capability approach to social justice (Sen, 1979) and the Rawlsian perspective (Rawls, 1971). Most importantly, extended access to education and health should be viewed as the primary driver of social empowerment across all strata of society. To achieve this goal, we project in our benchmark global justice scenario that total education and health expenditure should rise from 13% of world GDP in 2025 (with very large disparities, from 8% in Sub-Saharan Africa and South and Southeast Asia to 23% in North America/Oceania) to about 30% of world GDP in 2050 and 38% in all countries by 2100[PIN| |See Chancel et al, 2026, Figure 29]. One of the core missions of the Global Justice Fund is to help finance this big push in education and health between 2026 and 2050, together with the big push in climate investment.
 
It should be noted, however, that as things stand today, this big push by the GJF is unfortunately going to be insufficient to achieve equal access to education and health in the coming decades. This is because large and extreme inequalities in access to health and education characterize the world. Examining per-capita education expenditures across regions, we find that the figures range from as little as 209 Euros in Sub-Saharan Africa and 425 Euros in South and South-East Asia to as large as 4,100 Euros in North America/Oceania (Figure 2.5a). In other words, per-capita education expenditure is 20 times higher in North America/Oceania than in Sub-Saharan Africa. Given that the school-age population makes up a larger share of the population in poor countries, the gap would be even larger if we were looking at per-child expenditure[PIN| |See Bharti et al (2026) for a detailed analysis taking age structures into account in order to compare education and health expenditure between poor and rich countries. In brief: age effects go in opposite direction for education and health and tend to compensate each other]. In our global justice scenario, all countries are projected to converge to 8,400 Euros (PPP 2025) by 2100. However, by 2050, the gap will remain very significant, with per capita education expenditure almost 3 times as large in North America/Oceania and Europe (close to 6,000 Euros) than in Sub-Saharan Africa (around 2,000 Euros) (Figure 2.5b). This would still represent a very large reduction in the gap compared to 2025 (when the gap was 1 to 20), but there would remain substantial inequality of opportunity in access to education for children born in various world regions.

This may seem like a disappointing result, and in some ways it is exactly that: it reflects the fact that, in our view, the Global Justice Platform is a relatively moderate and gradualist platform (arguably too moderate and gradualist). The per capita country dividends distributed to the Global Justice Fund reach about 1,900 Euros at their highest point around 2030-2040, including, in our benchmark simulations, about 420 Euros for education, 630 Euros for health, and 850 Euros for climate investment (Figure 2.4b). These are significant amounts, but they are clearly not sufficient to bridge the education gap expressed in thousands of Euros that we have in 2025 between poor and rich countries (Figure 2.5a). At the same time, the total annual expenditures of the Global Justice Fund already represent about 10% of world GDP on average over the 2026-2060 period, far more than the total resources currently allocated to development aid and international organizations (Figure 2.2).
 
Recent research as part of the Global Justice Project has shown that the annual cost of global equal opportunity in education and health – i.e. the cost of providing to all individuals in the world the same education and health expenditure as the average levels that are currently available in Europe and North America/Oceania – would be around 30-35% of world GDP[PIN| |See Bharti et al (2026), Figures 10a-10c]. This does not even include the financial means for climate investment, implying that the Global Justice Fund’s total resources would need to be about 40% of GDP (four times larger than in our benchmark scenario) to fully achieve the principles of equal opportunity in education and health. In our view, equal opportunity should remain our moral target, and this is the position which should be advocated if a political deliberation were to take place in a worldwide political community. But this seems completely out of reach in the current state of the world, which is why we revert to a more modest, gradualist approach in our benchmark “global justice” scenario. Although this is not fully satisfactory, the education gap between poor and rich countries is reduced substantially between 2025 and 2050, thanks to the GJF, which would already be a very positive achievement. We will return to the question of scaling up the Global Justice Platform and the appropriate degree of gradualism versus radicalism when we analyze political strategies in Chapter 4.
 
The results we obtain for health expenditure are even more extreme. In 2025, per capita expenditure on health varies from 113 Euros in Sub-Saharan Africa to 8,301 Euros in North America/Oceania (all amounts in PPP 2025 Euros), i.e., a gap of almost 1:80 (Figure 2.6a). Thanks largely to the Global Justice Fund, we project that the gap will be reduced to about 1 to 3 by 2050 (with about 4,000 Euros in per capita health expenditure in Sub-Saharan Africa and 10-12,000 Euros in Europe and North America/Oceania). By 2100, all countries are projected to converge to high-quality health for all, with per capita expenditure equal to 14,400 Euros everywhere (Figure 2.6b). Although this is again more gradual than what the principle of equal opportunity would imply, we believe that this would be a very meaningful achievement.

We again stress that country dividends are not meant to be sufficient to fund all new climate investment and human capital expenditure as envisaged in our benchmark “Sustainable Convergence” scenario. Given the large projected rise in human capital expenditure (from 13% of GDP in 2025, on average at the world level, to 38% by 2100), there is no way this can be financed by the GJF alone. Most of it will consequently have to be financed by national budgets. According to our estimates, the total financial needs associated with our benchmark scenario amount to about 10-12% of world GDP per year over the 2030-2060 period[PIN| |See Chancel et al, 2026, Figure 52, and Bothe et al, 2026, Figure 3. These are lower bound estimates, including a fraction of additional human capital expenditures that are projected over the period], which is significantly larger than country dividends, especially during the 2040-2060 period. The most country dividends can do is to help jumpstart the “Sustainable Convergence” process, especially during the 2030-2040 period, after which country-financed investment will have to play the leading role. The key question is whether this jumpstart strategy can generate sufficient political support – both in the Global South and in the Global North –to be adopted in the first place and sustained in the longer run. 
 
Finally, we have estimated the extent to which the projected rise in human capital expenditure in our benchmark scenario can contribute to global socioeconomic convergence. By using recent estimates of the historical impact of human capital expenditure on productivity (Bharti et al, 2026), we find that the projected rise in human capital expenditure can account for a large fraction (about 50-70%, depending on the regions and the assumptions on parameters) of projected productivity convergence for countries in Sub-Saharan Africa and South and South-East Asia[PIN| |See Bothe et al, 2026, Figure 33]. It is worth stressing that the estimated rates of return to human capital expenditure (and particularly to public education and health expenditure) in terms of additional productivity (hourly GDP) appear to be substantially larger in poor countries than in rich countries, which runs against the widespread perception (especially in the North) of less efficient government spending in the South. If anything, governments in the South appear more cost-effective than those in the North at transforming their very limited resources into meaningful socioeconomic outcomes[PIN| |See Bharti et al, 2026, Table 5. The average global rate of return to education and health expenditure appears to be around 10% per year, up to 15-20% or more in poor countries. The main reason explaining why private investors do not finance such high-yield investment – and why public financing is needed – is simply that they cannot appropriate the corresponding human capital assets (for good reasons)].

2.3 The World Sovereign Fund: A New Balance between Public & Private Wealth

A key pillar of the Global Justice Fund’s overall architecture is the World Sovereign Fund, which plays a crucial role in both financing country dividends and reorienting global investment. The creation of the World Sovereign Fund should be viewed as part of a larger attempt to transform the structure of the property regime and to implement a new form of “mixed property” system, including a more balanced distribution between public and private wealth, as well as between private wealth owners and workers.
 
The World Sovereign Fund will be financed by a mix of global wealth and income taxation (the details of which we discuss below). As noted above, the accumulation of the WSF would be made possible by reinvesting a large share of global tax revenue, especially the global wealth tax on the very top wealth holders (billionaires, centimillionaires, decamillionaires), over the 2026-2035 period. According to our benchmark scenario, the assets of the World Sovereign Fund are set to stabilise at about 60% of world GDP around 2035 and remain at this level over the 2035-2100 period. This corresponds to about 10% of the world capital stock. Other (non-WSF) public wealth is scheduled to stabilize around 120% of world GDP (about 20% of world capital stock), so that total public wealth reaches about 30% of national wealth by 2100 (Figures 2.7a-2.7b). Private wealth is assumed to stabilise at about 70% of national wealth, including 65% in personal household wealth and 5% in non-profit wealth (i.e., wealth owned by non-profit institutions)[PIN| |See Bothe et al, 2026, Figure 11. The target which we set for non-profit institutions is similar to the level observed in 2025 in the countries with the largest non-profit sector (including the US)].

In effect, according to this scenario, the share of public wealth in national wealth will be back in 2100 to approximately the same level as that observed in 1970 at the world level. Although this is little more than a return to the 1970 world average, it would represent a major political and economic turning point compared with the evolution observed in recent decades. According to our estimates, the share of public wealth in national wealth has declined from 27% in 1970 to 13% in 2025. It has even turned negative (more public debt than public assets) in US-led North America/Oceania and is only slightly positive in Europe, reflecting both the privatization of public assets and the rise of public debt. We see a similar evolution across many regions of the world, but it is worth noting that there are important variations and exceptions[PIN| |See Bothe et al, 2026, Figure 12b]. In particular, the share of public wealth in China-led East Asia has stabilized at about 30% of national wealth (with a public share below 10% for housing but over 50% for other capital assets, particularly in the corporate sector) over the past 20 years. Some countries have also developed unusually large sovereign funds, in particular Norway, with net public wealth over 500% of GDP and 60% of national wealth in 2025. More generally, one striking lesson emerging from the comparative and historical study of national wealth is that the structure of property regimes – and especially public vs private wealth patterns – displays large and striking evolutions over time, reflecting major shifts in dominant political discourses, power relations and policy priorities[PIN| |See Bauluz et al (2025)]. Note that while the World Sovereign Fund, which we envision may seem smaller in relative terms than Norway’s sovereign fund (60% of GDP vs 500% of GDP), the key difference is that the WSF is scheduled to take place at the world level, so that in volume terms it is a lot larger (about 40 times larger than Norway’s sovereign fund)[PIN| |Norway’s GDP represents 0.3% of world GDP, and its sovereign fund about 1.5% of world GDP].
 
The shift to this new form of “mixed property” system, which we project over the 2026-2100 period, serves two main purposes within the context of the Global Justice Platform. First, the World Sovereign Fund provides significant investment income, playing a crucial role in financing country dividends on a long-term basis. Next, the rise of the public share in national wealth – both via the World Sovereign Fund and via non-WSF public wealth – will contribute to reorienting investment flows toward sustainable development. As noted above, both effects are large and comparable in magnitude. For instance, during the 2026-2100 period, we project that the Global Justice Fund distributes on average 4.3% of world GDP per year in country dividends and controls 3.5% of world GDP in investment flows (Table 2.1). Historical and contemporary evidence suggests that an excessive reliance on private ownership makes it more difficult to pursue sustainability objectives and to resist profit-making pressures (including in the energy sector), and conversely that public control over a substantial fraction of investment flows can contribute towards setting new environmental and social rules (both in the energy sector and other sectors)[PIN| |See Chancel (2025) and Chancel and Mohren (2025)].
 
Several remarks should be made about this scenario. Generally speaking, we certainly do not mean that all countries should adopt the same property regime. What matters most from the viewpoint of the Global Justice Platform is the size of the World Sovereign Fund (to finance adequate country dividends and reorient investment flows) and the fact that all countries follow the Sustainable Convergence trajectory (especially regarding human capital expenditure and the low-carbon energy transition).  In our benchmark scenario, all countries are assumed to have a domestic capital stock converging to approximately 600% of GDP by 2100, including about 280% in housing (dwellings and land underlying dwellings) and 320% in other capital assets (other buildings, equipment, machinery, energy and transport infrastructures, etc.)[PIN| |See Chancel et al (2026), Figure 10 and Appendix Figure Jk2]. The exact details of the property regime – i.e., who owns these different capital assets and under what rules – should be left to country-level experimentation. The perfect combination of public, personal and non-profit wealth remains to be invented, and all countries should participate in this process of collective learning and experimentation, for instance, regarding the role of workers’ representatives, citizens’ involvement, and voting procedures in the various forms of organization. Some countries might decide to allocate more than 20% of non-WSF public wealth in national wealth (such as China or Norway today, with very different underlying governance rules). Others might opt for a lower share, for instance, because they rely more extensively on non-profit institutions and/or workers’ representatives in privately owned corporate organizations.
 
More generally, the target property regime which we set for 2100, namely 30% for public wealth (including 10% for the World Sovereign Fund and 20% for other public wealth) and 70% for private wealth (including 65% for personal wealth and 5% for non-profit institutions), should be viewed as merely indicative. In practice, the exact governance rules within each sector can matter even more than the sectoral shares. For instance, the co-management or codetermination rules which have been applied in Germany and Nordic Europe since the 1950s (with up to 50% of voting rights for workers representatives in corporate boards in large companies, independently from any equity ownership) could be extended to all countries and organizations (irrespective of size), together with a limitation of voting rights to 10% for individual shareholders in large corporations (say, with more than 100 employees, with a gradual cap for smaller firms). In the event such a system were in place, it is unclear whether this should still be described as “private property” or whether it would be more appropriate to call it “mixed property”, “socialized property”, or “worker-managed property”[PIN| |This system has been described as a form of “participatory socialism” by Piketty (2020; 2022, Figure 18). See also Ferreras (2026) for a synthesis of proposals on economic democracy and McGaughey (2025) for an analysis of the changing frontier between public and private ownership]. Our own preference would be to move as far as possible towards worker-managed organizations and participatory governance, within a broader process of decommodifying the economy[PIN| |See the discussion in Chapter 1. See also Piketty (2025). Accelerated decommodification would likely imply an accelerated compression of the capital share and a corresponding change in the GJF financing structure (less investment income, but more non-financial benefits associated to sustainable investment and/or more global income tax revenue thanks to higher labour incomes). See the discussion below]. But this is clearly an area where a lot can be learned from the diversity of country experimentation strategies. There is no reason to restrict in advance the directions this collective learning process should take.
 
We now come to the WSF investment strategy. Generally speaking, there are many issues regarding the functioning of the WSF for which we do not aim to provide complete answers. These issues should be discussed extensively and democratically in the context of the Global Justice Fund. Given the magnitude of the country dividends and the importance of the conditionalities attached to these dividends (see Chapter 2.2), it is probably justified to start with a relatively centralized system, in the sense that the WSF should be administered at the level of the GJF as a whole, at least over the 2026-2050 period. It is also possible to envision a more decentralized system, especially during the 2050-2100 period, as global socioeconomic convergence becomes more pronounced. By the end of the 21st century, when the convergence process is over, it might make sense to hand over to the national governments the full control of the country shares in the WSF. One may also argue that it is useful to keep significant resources (about 10% of the world capital stock) under shared democratic control at the global level on a permanent basis.
 
In our benchmark simulations, we assume that the WSF invests its resources in a balanced portfolio of capital assets that is representative of the world capital stock as a whole. The gross return on these capital assets is therefore assumed to follow the same evolution as the world gross rate of return to capital, which is assumed to gradually decline over time, in line with the projected rebalancing of capital and labour shares (an evolution which could go even further)[PIN| |See Bothe et al, 2026, Figures 14a-14d. The gross capital share rose from 38% of world GDP in 1970 to 46% in 2025 and is projected to decline to 36% by 2100. The net capital share (after deduction of consumption of fixed capital) rose from 28% of world NDP in 1970 to 34% in 2025 and is projected to decline to 24% by 2100. Given the projected rise in capital-output ratios, this implies that the gross rate of return drops from 8.9% in 2025 to 6.0% in 2100 (and the net rate of return from 5.4% to 3.4%). Note that the rise of the capital share over the 1970-2025 period is due to a multitude of economic, political and institutional factors, in particular the rising bargaining power of capital owners, the decline of unions and the deregulation of global capital flows. Reverting this trend requires substantial policy changes, including new labour market institutions and increased voice and power for workers representatives. Going further in the direction of reduced capital shares would compress the flows of WSF investment income but entails benefits in other dimensions, namely by raising labour income flows going to large segments of the population. GJF financing strategy would need to be adapted to the new situation, e.g. by raising more revenue on upper and upper-middle labour income earners via the global income tax]. In addition, we assume that the WSF issues public debt equivalent to about 30% of world GDP in the long run, so that the total assets invested by WSF can stabilize at about 90% of world GDP, with net WSF wealth equal to 60% of world GDP. For the sake of completeness, we also assume that non-WSF public debt will stabilize at 60% of world GDP in the long-run, with non-WSF public assets equivalent to 180% of world GDP and net non-WSF public wealth equal to 120% of world GDP[PIN| |See Bothe et al, 2026, Figure 13].
 
Several remarks should be made about these assumptions. First, the assumption that WSF assets earn the average world return on capital can be viewed as relatively conservative. If the only objective of the WSF were to generate the largest possible investment income, then it would certainly be possible to do better[PIN| |In particular, the average gross return to capital is substantially larger in the South than in the North, so that the WSF could increase significantly its investment income by investing a bigger share of its portfolio in Sub-Saharan Africa or in South & Southeast Asia than their share in world GDP and capital stock (which would also make sense from the viewpoint of sustainable convergence). In addition, the world capital stock includes a sizable stock of relatively low-return assets like housing and especially government buildings and infrastructures (whose net return is conventionally set to zero in national accounts, which a sovereign fund might choose to ignore in order to maximize its financial returns)]. On the other hand, there are good reasons why the WSF might also use non-financial criteria in its portfolio choices. In our view, the WSF should contribute to reorienting global investment toward sustainable development, which implies that its portfolio choices should be based on ambitious environmental and social criteria, even if this comes at the cost of lower returns (but with other non-financial benefits)[PIN| |In case the investment choices of the WSF lead to lower total investment income than our benchmark projections, then country dividends might need to be reduced accordingly. But in principle this should be compensated by the fact that these lower financial returns come with non-financial benefits in terms of sustainable development, which reduces the needs for country dividends]. The right balance should be set by GJF and WSF governance bodies after extensive deliberation. Similarly, we cannot decide in advance to what extent WSF assets should concentrate on certain sectors, such as low-carbon energy infrastructure (which would make sense given WSF’s missions), or play a significant role in all sectors (to influence environmental and social norms across the economy, which also makes sense). 
 
Next, regarding public debt, our benchmark assumptions can also be viewed as relatively conservative. Total public debt is about 109% of world GDP in 2025 and is projected to decline to 90% of world GDP by 2100 (including 30% in WSF debt and 60% in non-WSF public debt). The main reason for this assumption is that one of the objectives of the Global Justice Platform is to reduce the overall financialization of the economy (i.e., the overall size of financial assets and liabilities relative to real economic variables such as GDP or the capital stock)[PIN| |In particular, we aim to reduce the size of cross-border financial assets and liabilities. Total gross financial assets and liabilities have increased from 20% of world GDP in 1970 to 64% in 1990 and 218% in 2025, and in our benchmark projections we aim to reduce them back to 64% by 2100. See Bothe et al, 2026, Appendix Figures B4a-B4d]. On the other hand, allowing for larger public debt would enable the WSF (and national governments) to benefit from a stronger leverage effect and to own a larger share of the economy’s productive assets[PIN| |See Bothe et al, 2026, for a more detailed discussion]. The most natural solution would be to denominate WSF public debt in international currency, by using the UNC (United Nations Currency), which, according to the Global Justice Report, should be issued by the UNCB (United Nations Central Bank), as described in further detail in Chapter 3. In case this is not possible, WSF public debt could also be denominated on the basis of a basket of currencies, for instance, by applying the same weights currently used by the IMF for issuing SDRs (Special Drawing Rights)[PIN| |In any case, we assume in our benchmark scenario that all countries will pay the same low nominal interest rate on their public debt over the 2030-2100 period (3%), thanks to the reform of the monetary system and the creation of an International Clearing Union (ICU). See Chapter 3 and Bothe et al (2026)].
      
According to our benchmark estimates, the World Sovereign Fund is set to generate total investment income of around 4.8% of world GDP on average over the 2026-2100 period (see Table 2.1), including 4.0% without the leverage effect from WSF public debt issuance and 0.8% from the leverage effect[PIN| |See Bothe et al, 2026, Table 8]. Given that the public debt issued by the WSF is likely to be a particularly safe and liquid asset, it is possible that it will benefit from an even lower interest rate, which would amplify the leverage effect. The same would happen if the WSF issues more debt than in our benchmark scenario. Conversely, in case the WSF issues no debt at all, then the investment income would be reduced by about 0.8% of world GDP on average over the 2026-2100 period, and the country dividends would need to be reduced accordingly.

2.4 The Global Wealth Tax: Millionaires and Billionaires

We now move to the revenue side of the Global Justice Fund, namely the global wealth and income taxes. As discussed in Chap. 2.1, the global wealth tax on top wealth holders is crucial for kickstarting the sustainable growth path envisaged by the Global Justice Platform. The basic structure of the global wealth tax schedule, which we propose to apply in our benchmark scenario, is described in Table 2.2. Tax rates rise gradually from 0% at the level of 10 times average world per adult wealth (about 1.1 million Euros in 2026) to 1% at 20 times average wealth (2.2 million), 3% at 50 times average wealth (5.5 million), 5% at 100 times average wealth (11 million), 10% at 500 times average wealth (55 million), 15% at 1000 times average wealth (110 million) and 20% at 5000 times average wealth (550 million). Tax rates are expressed as effective tax rates and are assumed to rise linearly between thresholds. For instance, with wealth equal to 15 times the average wealth, the effective tax rate is 0.5%. Similarly, with wealth equal to 3000 times the average wealth, the effective tax rate is 17.5%. Above 5000 times the average wealth, the effective tax rate is stable at 20%. All billionaires pay a global wealth tax equal to 20% of their wealth[PIN| |Thresholds and effective tax rates have been set so that implicit marginal tax rates follow smooth patterns and are always below 100%. See Bothe et al, 2026, Appendix Table TE4f for full tax schedule].

Although the exact details regarding the thresholds and tax rates are merely illustrative, the orders of magnitude are important. The tax schedule was set to generate the tax revenues needed for the Global Justice Platform and the Sustainable Convergence scenario. The exact tax rates and thresholds can vary somewhat, but if they change by too much, then it might not be possible to finance the same policies (low-carbon energy infrastructures, education and health expenditures, etc.) and achieve the same climate objectives (with temperature rise limited to 1.8°C by 2100 in our reference scenario rather than 4.5°C or more under current policies).
 
From a historical perspective, the closest precedent to the kind of wealth tax that we are proposing here are the exceptional progressive wealth taxes that were successfully applied in the aftermath of World War 1 and World War 2, with top tax rates around 50-90% or more in many countries (including Germany and Japan). At the time, these policies were designed to fulfil multiple objectives, including funding post-war reconstruction, compensating low- and middle-wealth households who had been most affected by the war, and curbing the power and influence of the very top wealth holders[PIN| |In Germany, the “Lastenausgleich” (“burden-sharing”) system set up after World War 2 included a top wealth tax rate equal to 50% for the largest wealth holders. In Japan, the top wealth tax rate was 90%. In France, the “Impôt de solidarité nationale“ (ISN) set up in 1945 included a top tax rate equal to 20% on top wealth holders and 100% on the wealth increment for taxpayers with rising nominal wealth between 1938 and 1945. Exceptional wealth taxes were also applied in many other European countries after World War 1 and again after World War 2. On the history of these exceptional wealth taxes and other capital levies, see e.g. Eichengreen (1990), Hughes (1999) and Piketty (2020, 2022)]. The current situation shares some important similarities with the postwar context, in particular, the need to raise significant resources to meet today’s development and environmental challenges. That being said, there are also many important differences. In particular, we are considering the possibility of a global wealth tax rather than a national tax (in line with today’s global warming challenges) and of a permanent tax (rather than a one-off exceptional tax)[PIN| |The main advantage of permanent wealth taxes over one-off taxes is that they can prevent wealth concentration to rise again to extreme levels in the future. In practice, the frontier between permanent and one-off wealth taxes is relatively fluid. For instance, the exceptional wealth taxes set up after World War 2 could often be paid over several years (sometimes several decades). Conversely, the permanent wealth tax advocated here raises most of its lifelong revenues in its early years].
 
We should also make it clear that the global wealth tax applies to all forms of wealth, including housing, business assets, and financial assets (net of financial liabilities), without any exemptions. For very top wealth holders (e.g., billionaires subject to the 20% effective tax rate), the global wealth tax will generally be much larger than their annual income, so the only way to pay the tax will be to sell assets. This can generally be done in two ways. The simplest way is to pay the tax in securities[PIN| |This method was frequently used in the past, in particular in the context of postwar exceptional wealth taxes. See e.g. Brassac (2026) about the French ISN. The tax could be paid in shares and other securities, which were then allocated to the “Société nationale d’investissement” (a sovereign fund)]. In effect, taxpayers can transfer the corresponding assets to the World Sovereign Fund, which can later decide to retain them or reshuffle its portfolio. The other way is to sell assets to other individuals, typically to less wealthy individuals who are not subject to high tax rates (or might even benefit from GJF transfers and new policies), and to use the proceeds to pay the tax. The GJF and/or national governments may also decide to encourage asset purchases by other individuals, for instance, by employees of the companies in question, to promote participatory governance and workers’ empowerment[PIN| |This could come together with legislative changes granting more voting rights for employee representatives in corporate boards (independently from equity ownership)].
 
According to our simulations, about 1.3-1.5% of the world population is subject to the global wealth tax over the 2026-2050 period (mostly coming from the richest regions), and less than 0.5% of the world population after 2060 (with a more balanced regional distribution) (see Figure 2.8a). The decline in the fraction of taxpayers follows from the endogenous fall in wealth concentration, which is itself due to the wealth tax (as top wealth holders must transfer or sell assets to pay it) and to the decline in income concentration (as we shall see below). For simplicity, we assume that the same wealth tax schedule (with bracket thresholds expressed as multiples of average world wealth; see Table 2.2) applies throughout the 2026-2100 period[PIN| |With only minor changes for bottom brackets. See Bothe et al (2026) for a detailed analysis].

Note that the fraction of wealth tax taxpayers varies significantly across regions over the 2026-2050 period: up to 4-7% of the population in the richest regions (Europe, North America/Oceania), and less than 0.5% in the poorest regions (Sub-Saharan Africa, South & South-East Asia). The fraction of taxpayers then falls below 0.5% of the population in all regions after 2060 (see Figure 2.8b). It is worth stressing that all millionaires and billionaires of the world are treated in the same manner by the global wealth tax: what matters is the level of their wealth, not where they come from.

To better understand the structure of wealth tax revenues, it is useful to look in more detail at the bracket-level simulation results. In 2026, we have about 1.3% of the world population paying the global wealth tax, including 0.9% (about 52 million adults) in the bracket going from 1.1 to 2.2 million Euros in per adult wealth, 0.3% (19 million adults) in the 2.2-5.5 million bracket, 0.1% (5 million adults) in the 5.5-55 million bracket, 0.004% (217 thousands adults) in the 55-552 million bracket and less than 0.001% (29 thousands adults) in the last bracket (552 million and over) (Table 2.3). Given that there are often two adults per household, the last bracket can be viewed as the “billionaire class”, i.e. couples with more than 1.1 billion Euros in net wealth. For the sake of concreteness, we will also refer to the 55-552 million bracket as the “centimillionaire class” (couples with wealth in 110m-1.1b range), the 5.5-55 million bracket as the “decamillionaire class” (couples in 11m-110m range) and the 1.1-5.5 million bracket as the “millionaire class” (couples in 2.2m-11m range)[PIN| |The tax brackets are defined as multiples of average world wealth, so the exact levels vary over years. All WID series on wealth and income distribution are available both in per adult and per capita terms. Our raw sources are usually expressed in per adult terms (e.g. tax data is often available at the individual level, or at the married couple level in some countries, in which case we divide income and wealth by two in the absence of any other information). At the world level, total population is about 1.48 times adult population in 2026 (8.291 billion vs 5.604 billion), so that per capita average income and wealth levels are on average about 1.48 time smaller than per adult average levels. Our estimates are broadly consistent with Forbes billionaire lists. See Bothe et al, 2026, section 2.2 for a detailed comparison].

If we look at tax revenues by wealth bracket, the striking result is that millionaires, decamillionaires, and centimillionaires pay more in taxes than billionaires, despite the fact that we use steeply progressive tax rates. In 2026, billionaires do pay very substantial revenues: 4.2% of world GDP, according to our simulations. Taken together, other taxpayers pay even more: 6.1% of world GDP, including 1.0% for millionaires, 2.4% for decamillionaires and 2.7% for centimillionaires (see Figure 2.9a). This result is even more striking when we cumulate tax revenues over several years. Namely, over the 2026-2035 period, cumulated wealth tax revenues represent 64.2% of world GDP, including 16.2% paid by millionaires, 19.7% by decamillionaires, 16.5% by centimillionaires and 10.8% by billionaires (see Figure 2.9b). Generally speaking, tax revenues from the highest wealth brackets tend to decline quickly over time, as the corresponding taxpayers cede their assets to pay the tax. This illustrates why, in order to generate sufficient revenue, the global wealth tax proposed in the Global Justice Platform cannot rely solely on billionaires. 

2.5 The Global Income Tax and the Compression of the Income Scale

The basic structure of the global income tax schedule, which we propose to apply in our benchmark scenario, is described in Table 2.4. Tax rates rise gradually from 0% at the level of 7 times average world per adult disposable annual income (149 100 Euros in 2026) to 5% at 10 times average income (213 000), 20% at 20 times average income (426 000), 40% at 50 times average income (1.1 million), 50% at 100 times average income (2.2 million), 70% at 500 times average income (11 million), 80% at 1000 times average income (22 million) and 90% at 5000 times average income (110 million). As with the wealth tax, tax rates are expressed as effective tax rates and assumed to rise linearly between thresholds. For instance, with income equal to 8.5 times the average income, the effective tax rate is 2.5%. Similarly, with income equal to 3000 times the average income, the effective tax rate is 85%. Above 5000 times the average income, the effective tax rate is stable at 90%[PIN| |Thresholds and effective tax rates have been set so that implicit marginal tax rates follow smooth patterns and are always below 100%. See Bothe et al., 2026, Appendix Table E5f for full tax schedule].

Several points are worth stressing about this tax schedule. First, like the global wealth tax, the global income tax operates alongside national tax systems and targets the very top of the global income distribution. This also explains why the global income schedule is expressed as a function of post-tax net disposable income, i.e. after deducting all country-level income taxes and other taxes. This provides an incentive for countries to compress their income distributions further. In case they do not reduce sufficiently the level of their top incomes (via taxation or other policies such as rigid salary scales or other schemes; more on this later), then they will pay higher global income tax liabilities to the Global Justice Fund.
 
Next, although the global income tax plays a smaller role than the global wealth tax in the Global Justice Platform, we stress that income tax revenues are significant: 4.0% of world GDP on average in 2026-2035, vs 6.7% for wealth tax revenues (see Table 2.1 and Figure 2.3a). According to our simulations, about 1.0-1.1% of the world population is subject to the global income tax over the 2026-2050 period (mostly coming from the richest regions), and less than 0.5% of the world population after 2060 (with a more balanced regional distribution) (Figure 2.10). The decline in the fraction of taxpayers follows from the fall in country-level income concentration (as we shall see below). For simplicity, we assume that the same global income tax schedule (with bracket thresholds expressed as multiples of average world income, see Table 2.4) applies throughout the 2026-2100 period[PIN| |With only minor changes for bottom brackets. See Bothe et al (2026) for a detailed analysis]. Note that the fraction of taxpayers varies significantly across regions over the 2026-2050 period: up to 4-7% of the population in the richest regions (Europe, North America/Oceania), and less than 0.5% in the poorest regions (Sub-Saharan Africa, South & South-East Asia). The fraction of taxpayers falls below 0.5% of the population in all regions after 2060[PIN| |See Bothe et al. (2026), Figure 9b].

We stress again that all high-income earners worldwide are treated the same way: what matters is their income level, not where they come from. Note also that we define income thresholds and tax rates using PPP Euros (based upon purchasing power parities) in our benchmark simulations, which means that high-income taxpayers in poor countries will pay high taxes even if their MER income (using market exchange rates) is not so high. In our view, this is the most meaningful way to proceed, as PPP income levels arguably provide the most comparable estimates of living standards across countries[PIN| |For consistency reasons, we do the same for the wealth tax. In case we were using MERs rather than PPPs to define the thresholds and tax rates used in the global income and wealth tax schedules, then we would have more taxpayers and higher taxes in rich countries and fewer taxpayers and lower taxes poor countries which we now have. Global tax revenues would be little affected].
 
There are many historical precedents – at the national level – of the steeply progressive income tax that we are proposing here at the global level. Most developed countries applied very high tax rates (70-80% or more) to their highest income earners at one point or another during the 1920-1990 period. In particular, the top tax rate used in the US federal income tax was equal to 81% on average over the 1930-1980 period (without even including state and city-level income taxes). Available historical evidence shows that this contributed to a sharp compression of the income scale, and that this did not entail any measurable negative impact (and possibly had a positive effect) on productivity growth. High top tax rates appear to curb the market power and pay-setting capacity of top managers and other top earners. This benefits lower-income earners in their companies (who can bargain for better wages) and the economy in general, without creating a noticeable distortion (but rather by removing one)[PIN| |See Andreescu, Arias-Osorio et al (2025). See also Piketty (2020, 2022). In effect, once the market power and pay-setting capacity of top managers and other top earners is taken into account, optimal tax rates on very high incomes can easily reach 80-90%. For theoretical models and empirical calibrations, see Piketty and Saez (2013) and Piketty, Saez and Stantcheva (2014)].
 
As with the wealth tax, it is useful to analyze the bracket-level simulation results in more detail. In 2026, we project that we have about 1.1% of the world population paying the global income tax, including 0.5% (about 30 million adults) in the bracket going from 149k to 213k Euros in per adult disposable income, 0.4% (23 million adults) in the 213k-426k bracket, 0.1% (7 million adults) in the 426k-1.1m bracket, 0.025% (1.4 million adults) in the 1.1-2.1 million bracket, 0.01% (551 thousands adults) in the 2.1-21 million bracket, and less than 0.001% (29 thousands adults) with 21 million and over (Table 2.5). As one can see from the simulations, all tax brackets are important to generate large income tax revenues (4.5% of world GDP in 2026). If one were to rely solely on individuals with several million euros (or several dozen million euros), then tax revenues would be divided by two or more; it is also critical to tax individuals with several hundred thousand euros[PIN| |See Bothe et al. (2026), Figures 10a-10b]. Generally speaking, tax revenues from the highest income brackets will tend to decline quickly over time in our benchmark scenario. This is due to the cumulated impact of the global income tax itself (which reduces the market power and pay-setting capacity of top managers and other top earners), the global wealth tax (which reduces wealth concentration and therefore top capital income flows) and most importantly, the country-level policies implemented to compress the income distribution (more on this below).

2.6 Global Justice: an Income Scale of 1 to 5, a Wealth Scale of 1 to 10

One of the central objectives of the Global Justice Platform is to achieve a substantial compression of the income and wealth scales over the 2026-2100 period. As noted above, global wealth and income taxes are designed both to raise the resources needed to finance the GJF and to curb the concentration of income and wealth at the top of the global distribution. At the same time, country-level policies – including country-level progressive income and wealth taxation, minimum wage policies, pay scale regulations, labour market rules, co-determination and workers’ representation on corporate boards – are expected to play the leading role in reshaping the domestic distribution of income over the long run.
 
According to the Global Justice Platform, the income scale within each country is projected to converge to a range of 1 to 5 over the 2026-2100 period. More precisely, the ratio between percentile thresholds P99.9 and P10 of the distribution of post-tax, posttransfer distribution of per capita net national disposable income (including all in-kind transfers), as defined by DINA Guidelines[PIN| |See Chancel et al (2025)], is projected to converge to 4.5 in all countries, with an absolute maximum gap of 1 to 5 (Figure 2.11a)[PIN| |By definition, the percentile threshold P99.9 corresponds to the income level above which 0.1% of the population is located, and the percentile threshold P10 to the income level below which 10% of the population is located. The absolute maximum gap of 5 corresponds to the ratio P99.999P100/P0P1 between the average income of the top 0.001% (P99.999P100) and the bottom 1% (P0P1), i.e. the top and bottom g-percentiles used in WID series. See Bothe et al. (2026), Appendix A].

Taking as given the trajectories of country-level post-tax income distributions, we simulate the endogenous evolution of country-level wealth distributions over the 2026-2100 period, based on simulated global wealth and income payments and the projected evolution of the saving-rate profile by percentile[PIN| |Simulations are computed at the level of the 57 WID core territories (i.e. 48 main countries + 9 residual regions) and of the 127 WID generalized percentiles (from the bottom 1% to the top 0.001%), making a total of 7239 country-gpercentile cells used to describe the world wealth distribution at any point in time. See Bothe et al (2026) and the online replication package and computer codes for full details]. Given our assumptions about the long-run profile of saving rates, the steady-state wealth distribution corresponds to a wealth scale of about 1 to 10 within each country (Figure 2.11b)[PIN| |In practice, our simulated wealth distributions in 2100 are very close to the target steady-state distribution. I.e. the bottom 50% wealth share rises to 30% of total wealth (vs 31% for the target) and the top 10% wealth share drops to 24% (vs 22% for the target)].


There are two main justifications for this objective of reducing income and wealth inequality. First, historical evidence shows that this evolution stands in the continuation of a highly successful long-run movement toward equality and prosperity, especially in Nordic and Western Europe (Andreescu, Arias-Osorio et al, 2025; more on this below). Next, because average monetary incomes will rise less quickly in our benchmark scenario over the 2026-2100 period than in the absence of sufficiency, it is critical to compress the income scale so that low- and middle-income groups are more strongly inclined to support such a strategy, especially in today’s rich countries.
 
In our benchmark scenario, the ratio between the post-tax income threshold of the 99th percentile and that of the 10th percentile (P99/P10) is projected to decline from about 37 today (ratio of population-weighted country thresholds) to 3.3 by 2100. Such a compression is very much in line with historical developments observed in Western and Nordic Europe during the 20th century. In effect, the P99/P10 ratio declined from about 32 in 1900 to 3.9 in 1990 in Nordic Europe (Figure 2.12a). In other words, what we are projecting for the world as a whole over the 2026-2100 period is of the same order of magnitude as what has already been achieved – over a similar time horizon – in the most advanced European countries during the 20th century.

The picture is very similar, albeit starker, if we focus on the P99.9/P10 ratio, which captures the gap between the thresholds of the 99.9th percentile (the top 0.1%) and the 10th percentile. This ratio is projected to decline globally from about 130 today to about 4.5 by 2100, against a historical decline from about 150 to 11 in Nordic Europe during the 20th century (Figure 2.12b).

Figure 2.13a summarises the historical compression of the post-tax income distribution in Nordic Europe over the 20th century and the projected evolution for the future. The share of the top 10% of incomes in total income is projected to continue its historical decline, from 52% in 1910 to 24% in 2025 and 18% by 2100. Similarly, the bottom 50% income share is projected to rise from 17% in 1910 to 33% in 2025 and 38% in 2100. In effect, the projected inequality compression for the 21st century is relatively modest as compared to the compression that already took place over the 1910-1990 period.

Figure 2.13b plots the same evolution for the wealth distribution. In Nordic Europe, the share of the top 10% wealthiest holders in total personal wealth fell from over 80% in 1910 to about 50-55% since 1980-1990. We project that the top 10% share will fall below 25% by 2100, mostly benefiting the bottom 50%, which until now has had a very small share of total wealth. This evolution follows from the cumulative impact of the projected compression of income inequality and the flattening of saving rate profiles (an evolution that the introduction of universal inheritance could facilitate)[PIN| |The main rationale for the projected flattening of the saving profile is the compression of the income scale itself: low-income percentiles now have more resources to save and do not need to consume everything in order to reach adequate living standards, and conversely high-income percentiles have less resources to accumulate if they want to keep certain standards. The saving profile can also be influenced by changing social norms about consumption and by policies aimed at raising saving incentives and/or at promoting specific saving vehicles (e.g. zero-interest loans in order to encourage home ownership or business creation), or even more directly by the redistribution of inheritance. See e.g. Piketty (2022) for a minimal inheritance scheme equal to 60% of average wealth (and allocated to each young adult at age 25) financed by progressive inheritance and wealth taxation. While we do not model explicitly the impact of such policies, this is likely to be one of the most effective ways to flatten the saving profile to the level assumed here. See Bothe et al, 2026, Figure 24].


By combining the projected compression in between-country and within-country inequality, we obtain our simulation results for the global distribution of income and wealth (Figures 2.14a-2.14b).

We find the redistribution of wealth to be particularly striking. The share of the bottom 50% of the world wealth distribution is projected to rise from about 2% of total personal wealth in 2025 to about 30% by 2100 (Figure 2.15a). Symmetrically, the wealth share of the top 0.001% – corresponding in 2025 to about 80 thousand individuals with an average per capita wealth of around 500 million Euros, i.e. broadly the world billionaire class – is projected to decline from 6.4% in 2025 to 0.05% by 2100 (Figure 2.15b)[PIN| |Note that this top 0.001% “billionaire class” (about 80 thousand individuals out of 8 billion) is somewhat larger than the billionaire group defined by the top wealth tax bracket, which includes approximately 30 thousand adults (i.e. a total population of about 45 thousand individuals). See Table 2.3]. In other words, the share of personal wealth held by the bottom half of the world population is multiplied by about 15, while the wealth share of the world billionaire class is divided by more than a hundred. By 2100, the regional composition of all wealth groups reflects approximately the regional distribution of the world population, as average wealth levels and wealth distributions converge across countries[PIN| |See Bothe et al, 2026, Figures 21a-21g, 26a-26g, 34a-34h and 37a-37g for a detailed analysis of the past and projected evolutions of regional bottom and top shares and levels, both for income and wealth. The average annual per capita income of the bottom 50% rises from little more than 2k Euros in 2025 to 38k in 2100, while the average income of the top 0.001% drops from about 25 million Euros to 164k. The average per capita wealth of the bottom 50% rises from about 2k to 140k, while the average wealth of the top 0.001% drops from about 500 million to 2.2 million. The wealth scale has not completely converged to its steady-state level of 1-to-10 by 2100, but it is getting close].

2.7 High Inequality is Not Necessary for Prosperity

Perhaps the most important point to stress in this context is that the 20th-century compression of the income scale did not come at the expense of prosperity. On the contrary, the countries that experienced the most substantial reduction in top-end inequality over this period – typically Nordic and Western Europe – are also those that experienced some of the most impressive productivity gains (Figures 2.16a2.16b). Hourly labour productivity – measured as GDP per hour worked, in PPP 2025 Euros – rose to unprecedented levels in Western and Nordic Europe during precisely the decades (1910-1990) when the income scale was most drastically compressed. More generally, the long-run historical record of the richest industrial economies clearly shows that very sharp declines in top-end inequality have been fully compatible with – and possibly have contributed to – very high rates of productivity growth and rising living standards. The experience of countries like the United States, which underwent a partial reversal of inequality during the 1980-2025 period, provides further evidence on this point. The United States, where top income inequality has risen markedly since the 1980s-1990s, does not exhibit higher productivity growth than Western Europe over the same period. Given their greater human capital investment, the US should have significantly higher productivity than Nordic Europe, and the fact that it has somewhat lower productivity suggests that the higher equality observed in Nordic Europe might have a positive residual effect[PIN| |.e. the potentially positive inclusiveness effect associated to higher equality seems to be larger than the potentially negative incentive effect. This could also reflect the higher cost-effectiveness of public education and health expenditure over private expenditure. It is well-known that higher private health expenditures in the US come with significantly worst health indicators relative to Europe. Existing estimates also suggest that a higher cost-effectiveness of public education expenditure over private education expenditure (in terms of their impact on productivity growth). See Bharti et al (2026)].

On the other hand, the experience of countries like China and India, where high growth since the 1980s and 1990s was accompanied by rising top-income concentration, may suggest that inequality is necessary for growth. In the case of China, productivity growth has risen substantially since 1980, but one can plausibly argue that this has little to do with rising inequality and rather with the end of central planning and the development of a more decentralized economic system. A similar argument can be made for India: the upsurge of growth since 1990 has arguably more to do with the abandonment of some of the ill-conceived policies of the previous period than with rising inequality per se. It is also striking that India has much more inequality than China but much lower productivity growth, which can, however, also be explained by larger and better-targeted human capital expenditure in China[PIN| |See Bharti and Yang (2024). It is also interesting to note that we observe substantially lower levels of inequality in Western Europe and especially Nordic Europe over the 1980-2025 period than in China during the Maoist period (1950-1980) or in Russia during the Soviet period (1920-1980). See Andreescu, Arias-Osorio et al, 2025, Figures 28-31. In other words, the problem with Maoist China or Soviet Russia does not seem to be an excessive level of equality in itself, but rather a specific set of policies and institutions (i.e. communist central planning rather than social-democratic welfare state)].
 
Taken together, these comparative and historical observations suggest that the equality targets envisaged by the Global Justice Platform are within the realm of historical experience and that there is no strong evidence to assume that such a reduction in inequality would necessarily be detrimental to prosperity. Controlling for levels of education and health expenditure, econometric evidence might even suggest that higher equality could entail a positive residual effect on productivity[PIN| |See Andreescu, Arias-Osorio et al, 2025, Tables 3-4. This positive effect is consistent with recent studies using experimental transfer programs (Banerjee et al, 2021; Balboni et al, 2022). Unfortunately, such experimental studies can look only at redistributive changes of limited macro magnitude. This positive effect is also consistent with larger scale studies using historical experiments from major land reforms, which typically find that land redistribution and stronger land tenure rights for poor peasants tend to raise productivity due to inclusiveness and empowerment effects See e.g. Banerjee et al (2002) and Banerjee and Iyer (2005). On the other hand, it is certainly possible to find examples of ill-functioning land reforms with poor efficiency impacts]. Because these estimates are highly uncertain, however, we choose to assume in our benchmark simulations that inequality has zero impact on productivity – neither positive nor negative. At the end of the day, only through new historical experimentation and institutional development will we be able to determine how far the historical march toward equality can go in the future[PIN| |There are so many time-varying differences between countries and historical contexts (e.g. regarding Western and Nordic Europe vs. the US, or China vs. India, or successful vs unsuccessful land reforms) that it is illusory to imagine that econometric evidence alone can settle such a complex issue. Statistical language should of course be brought to the democratic discussion, but with no pretention to close it].
 
We should finally stress that the compression of the income scale, which we project here, is to be achieved primarily through country-level policies, with the global income tax playing the role of a backstop incentive device (see Chap. 2.5). There are many different ways in which countries can proceed to compress their income distribution. These include progressive income and wealth taxation, minimum wage policies, pay scale regulations in the public and private sectors, co-determination and workers’ representation on corporate boards, limitations on the voting rights of individual shareholders in large corporations, support for collective bargaining and trade unions, and many other tools. In theory, one could reduce post-tax inequality entirely through taxes and transfers; that is, one could keep the same level of pre-tax inequality throughout the 2026-2100 period in all countries and adjust the country-level tax schedules and transfer systems to deliver the desired level of post-tax, post-transfer inequality. Available historical evidence, however, suggests that it might not be the most appropriate way to proceed. Namely, in practice, the substantial compressions of post-tax inequality which took place over the course of the 20th century – particularly in Nordic and Western Europe – relied to a large extent on the compression of pretax inequality (“pre-distribution” or “pre-tax redistribution”, as opposed to “post-tax redistribution”), thanks to multiple transformations of progressive tax systems (which have a strong impact on pre-distribution and not only on ex post redistribution), labour market institutions (including minimum wages, salary scales, collective bargaining, etc.), democratic governance rules, inclusive educational reforms, and so on[PIN| |See Blanchet, Chancel and Gethin (2022) and Bozio et al (2024) for detailed analysis]. The Global Justice Platform does not prescribe a single model and leaves country-level experimentation as the primary mode of social learning in this area. There are strong arguments in favour of pre-distribution, but countries should, in our view, have the choice over the exact set of policy tools and institutional reforms they want to implement, as long as they converge on a sufficiently compressed distribution, so as to meet the objectives of sustainable convergence and global justice[PIN| |In our benchmark scenario, we assume that the same predistribution-focused pattern will prevail in the future as in the past, namely the decline in pretax inequality will be similar in magnitude to posttax inequality decline over the 2026-2100 period. See Bothe et al, 2026, Fig. 22a-22b. However, this has no impact for our global income tax simulations, which only depend on post-tax income distributions].

2.8 Large Majorities Benefit from GJP, including in Rich Countries

We are now in a position to analyze the structure of winners and losers from the Global Justice Platform, both in comparison with 2025 monetary incomes and with alternative 2026-2100 development scenarios. Our main conclusion is that the vast majority of the population – about 95-98% in the Global South and 85-95% in the Global North – benefits from the GJP, but with large variations across countries and scenarios, potentially implying fierce political opposition from beyond just the ultra-rich[PIN| |In order to study these questions, we analysed fully integrated income and wealth distributions for g-percentiles for all world regions. See Bothe et al. (2026) for further results].
 
We start with a comparison with the monetary incomes of 2025 (Figure 2.17). At the global level, about 89% of the population sees their annual monetary income more than double between 2025 and 2100, while less than 2% experience an income decline. In the poorer regions (Sub-Saharan Africa, South & South-East Asia, Middle East/North Africa), about 99% of the population experiences a more than 100% increase in monetary income, with virtually no income decline. In the richer regions, by contrast, the share of the population gaining more than 100% drops to about 45% in North America/Oceania and 28% in Europe, while a significant minority experiences a monetary income decline (about 14% of the population in North America/Oceania and 6% in Europe).

It should be stressed that the segments experiencing an income decline correspond essentially to the top of the income distribution within each region. The vast majority of the population in rich countries – including the entire bottom and middle of the distribution, who also benefit from country dividends through better-funded education and health systems and from the compression of the income scale – clearly comes out ahead. It is crucial to note that these material benefits would be in addition to important non-monetary benefits associated with increasing leisure hours, limiting global warming, financing the energy transition, and curbing the destabilizing effects of extreme inequality. If we include estimates for the value of leisure, then we find that over 99% of the population is better off in 2100 than in 2025, including in the richest regions[PIN| |See Bothe et al, 2026, Figure 36b]. It should be noted, however, that some of the monetary losers – who make up sizeable minorities in North America/Oceania and Europe – might not share ex ante these valuations of extra leisure time.
 
We have also run similar simulations using wealth (rather than income)[PIN| |See Bothe et al, 2026, Figure 38 and Appendix Figure O5b. We have run simulations for private wealth and for augmented wealth (including the private value of public wealth)], as well as numerous simulations with varying magnitudes of compression of income inequality between 2025 and 2100. In our benchmark scenario, the income scale is compressed to 1 to 5 by 2100. If we compress the scale even further, say 1 to 3 or 1 to 4 rather than 1 to 5, then we find larger income gains for the bottom 80% of the population (and potentially stronger political support), but a larger fraction of losers at the top. Conversely, if the compress the scale less intensively, say 1 to 8 or 1 to 12 or 1 to 15 rather than 1 to 5, then we reduce the share of losers at the top, but at the expense of very small (or in some cases negative) income gains for the bottom 80%, which is maybe not a very promising road to follow from a political viewpoint. To summarize, the 1 to 5 scale appears to be a good compromise in order to generate large gains for the bottom 80% while limiting the share of losers at the top[PIN| |See Bothe et al, 2026, Appendix Figures P1a-P1j].
 
We now move to the comparison with alternative 2026-2100 development scenarios, namely the “Productivist Convergence” (PC) and “Persistent Inequality” (PI) scenarios analyzed in Chapter 1. We assume that both PC and PI scenarios follow an “Intermediate Decarbonization” trajectory, which corresponds approximately to current country pledges (an optimistic assumption). This leads to a temperature rise of around 4.2°C by 2100, compared with 1.8°C under “Sustainable Convergence” (SC). If we instead assume that the PC and PI scenarios follow a “Slow Decarbonization” trajectory (which roughly corresponds to current policies), the temperature rise would be as high as 4.8°C, thereby worsening the case for these alternative scenarios.
 
We start with a comparison against the PI scenario. If we only compare monetary incomes, i.e. if we do not value in any way the extra free time (leisure) nor the preservation of planetary habitability associated with the SC scenario, then by construction the comparison looks very good for the PI scenario, especially in rich countries, but also in many middle-income countries. In Europe, 96% of the population has a higher monetary income under the PI scenario than under the SC scenario; in North America/Oceania, the corresponding figure is 88%; at the world level, it is as high as 42%[PIN| |See Bothe et al, 2026, Figure 39a. In the PI and PC scenarios, we assume that each country keeps the same level of post-tax income inequality between 2025 and 2100]. At the same time, if we introduce what we consider to be plausible estimates for the valuation of free time (leisure) and planetary habitability[PIN| |See Chancel et al, 2026, Section 7 and appendix D for a detailed discussion of how we value free time and planetary habitability (including well-being and GDP losses) in our benchmark estimates. These are lower-bound estimates in the sense that we assume linear effects with respect to temperature rise and neglect entirely the issue on non-linearities and cataclysmic tipping points, which are very likely to happen if temperature rises gets above 2.5-3.5° C. Also, we assume that PI and PC scenarios come with ID trajectories, but at this stage it looks as if we are closer to SD trajectory, implying a larger temperature rise than we assume in our benchmark computations (4.8°C rather than 4.2°C)], then the situation changes completely: the fraction of the population favoring our Sustainable Convergence scenario over the persistent inequality scenario jumps from 4% to 83% in Europe, from 12% to 89% in North America/Oceania and from 58% to 95% at the world level (Figure 2.18a).
 

We obtain similar conclusions when comparing against the PC scenario (Figure 2.18b). The main difference is that the PC scenario is slightly less favourable than the PI scenario for the richest countries (from the viewpoint of monetary income), so that even larger majorities prefer the SC scenario after the valuation of free time and planetary habitability is taken into account.  

We draw several conclusions from these results. Generally speaking, the Global Justice Platform – or similar policy platforms – is likely to face fierce political opposition from significant fractions of the population in the Global North (and not just the ultra-rich in the Global North and the Global South) and will require very strong collective mobilization from lower- and middle-income classes to be adopted and implemented. The ultra-rich are obviously the main losers of the GJP in all countries, but much larger segments of the population – typically 5-10% of the population in the South and up to 10-20% of the population of the North – are on the brink of losing out from the GJP, especially if they do not place a high value on free time and planetary habitability. If the ultra-rich can convince these segments of the population that free time and planetary habitability have limited value, and reach even broader segments of the population with a similar message, then a platform like the GJP has little chance of being adopted. In other words, the key cultural and intellectual battle is not only about reducing inequality and taxing billionaires and multimillionaires: it is also about valuing sufficiency, free time and planetary habitability as such. This can only be achieved with the help of a broad citizen coalition documenting the value of sufficiency (including the shift to immaterial consumption, changes in food habits, and implied reforestation) and the damages of a large temperature rise and broader biodiversity loss. We will return to this discussion of political strategies in Chapter 4.